
Page 189 - IJB-7-4
P. 189
Fu, et al.
(LCST) . Micelle formation generally begins at 18- increased micelle packing and formation in the material.
[32]
20 w/v %, which is therefore the lowest concentration As follows, experimental results showed a significant
at which PL 127 can form a cohesive gel capable of increase in accuracy from 16°C to all higher temperatures.
printing [11,32] . If the material is above the lower critical Because of the relationship between micelle formation,
solution temperature, micelles will begin to become temperature, and material composition, an interaction
insoluble in the solution. As temperature increases, between temperature and composition could be used to
micelles will pack together, increasing viscosity, and further improve accuracy and differentiate parameters.
forming a gel . The temperature where this transition At higher concentrations, micelle formation begins at a
[32]
begins (the LCST) is dependent on concentration, with lower temperature due to polymer interactions . This
[32]
a higher concentration leading to a lower LCST due to is shown by the temperature sweep in Figure 1, where
the higher rate of polymer interactions . This is shown higher concentrations saw a sharp increase in viscosity
[32]
in Figure 1, where 30% PL 127 has a sharp increase in at a lower temperature than lower concentrations.
viscosity at 11°C, whereas 25% and 20% do not have the Therefore, at higher temperatures the difference between
same increase until 15°C and 19°C, respectively. 25% and 30% PL 127 may become more apparent as
An understanding of how each print parameter 30% will have begun micelle formation before 25% and
effects printability is an essential basis to optimizing their have accumulated more micelles and maintained a higher
effects. Material composition’s effects result from the viscosity. Because initial tests were both conducted at room
viscosity changes between samples. Adding PL 127 will temperature, this discrepancy may not have originally
create more viscous material which can improve structural been shown. In Figure 1, 25% and 30% viscosity are
integrity, prevent spreading on the print bed, and improve closer at room temperature than at higher temperatures.
structural fidelity. At the lowest, concentration must also This possibility could warrant further experimentation to
be high enough that micelle formation begins, and the optimize the interplay between parameters when effects
material gains enough viscosity at certain temperature to would otherwise have reached their individual limits.
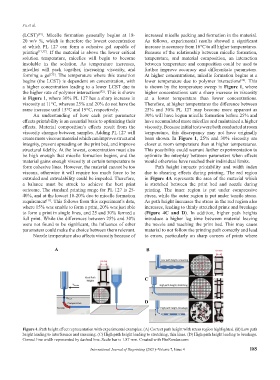
form cohesive lines. However, the material cannot be too Path height impacts printability and width index
viscous, otherwise it will require too much force to be due to shearing effects during printing. The red region
extruded and extrudability could be impeded. Therefore, in Figure 4A represents the area of the material which
a balance must be struck to achieve the best print is stretched between the print bed and nozzle during
outcome. The standard printing range for PL 127 is 25- printing. The inner region is put under compressive
40%, and at the lowest 18-20% due to micelle formation stress, while the outer region is put under tensile stress.
requirement . This follows from this experiment’s data, As path height increases the stress in the red region also
[11]
where 15% was unable to form a print, 20% was just able increases, leading to thinly stretched prints and breakage
to form a print in single lines, and 25 and 30% formed a (Figure 4C and D). In addition, higher path heights
full print. While the differences between 25% and 30% introduce a higher lag time between material leaving
were not found to be significant, the influence of other the nozzle and reaching the print bed. This may cause
parameters could make the choice between them relevant. material to not follow the printing path correctly and lead
Nozzle temperature also affects viscosity because of to errors, particularly on sharp corners of prints where
A B
C
D
Figure 4. Path height effect representation with experimental examples. (A) Correct path height with stress region highlighted. (B) Low path
height leading to interference and smearing. (C) High path height leading to stretching, thin lines. (D) High path height leading to breakage.
Correct line width represented by dashed line. Scale bar is 1.87 mm. Created with BioRender.com
International Journal of Bioprinting (2021)–Volume 7, Issue 4 185