
Page 187 - IJB-7-4
P. 187
Fu, et al.
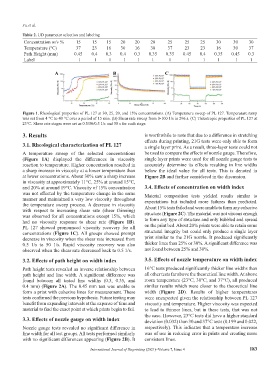
Table 2. UD parameter selection and labeling
Concentration w/v % 15 15 15 20 20 20 25 25 25 30 30 30
Temperature (°C) 37 23 16 30 16 30 37 23 23 16 30 37
Path Height (mm) 0.45 0.4 0.3 0.4 0.3 0.35 0.35 0.45 0.4 0.35 0.45 0.3
Label −1 −1 −1 −1 −1 1 1 −1 −1 1 −1 1
A B C
Figure 1. Rheological properties of PL 127 at 30, 25, 20, and 15% concentrations. (A) Temperature sweep of PL 127. Temperature ramp
was set from 4 °C to 40 °C over a period of 15 min. (B) Shear rate sweep from 0-100 1/s in 296 s. (C) Thixotropic properties of PL 127 at
23°C. Shear rate stages were set as 0.5/50/0.5 1/s and 50 s for each stage.
3. Results is worthwhile to note that due to a difference in stretching
effects during printing, 21G tests were only able to form
3.1. Rheological characterization of PL 127 a single layer print. As a result, three-layer tests could not
A temperature sweep of the selected concentrations be used to compare the effects of nozzle gauge. Therefore,
(Figure 1A) displayed the differences in viscosity single layer prints were used for all nozzle gauge tests to
reaction to temperature. Higher concentration resulted in accurately determine its effects resulting in line widths
a sharp increase in viscosity at a lower temperature than below the ideal value for all tests. This is denoted in
at lower concentrations. About 30% saw a sharp increase Figure 2B and further considered in the discussion.
in viscosity at approximately 11°C, 25% at around 15°C,
and 20% at around 19°C. Viscosity of 15% concentration 3.4. Effects of concentration on width index
was not affected by the temperature change in the same Material composition tests yielded results similar to
manner and maintained a very low viscosity throughout expectations but included more failures than predicted.
the temperature sweep process. A decrease in viscosity About 15% tests failed and were unable to form any cohesive
with respect to increasing shear rate (shear thinning) structure (Figure 2C). The material was not viscous enough
was observed for all concentrations except 15%, which
had no viscosity response to shear rate (Figure 1B). to form any type of structure and only bubbled and spread
PL 127 showed pronounced viscosity recovery for all on the print bed. About 20% prints were able to retain some
concentrations (Figure 1C). All groups showed prompt structural integrity but could only produce a single layer
decrease in viscosity when the shear rate increased from print similar to the 21G nozzle. It produced significantly
0.5 1/s to 50 1/s. Rapid viscosity recovery was also thicker lines than 25% or 30%. A significant difference was
observed when the shear rate decreased back to 0.5 1/s. not found between 25% and 30%.
3.2. Effects of path height on width index 3.5. Effects of nozzle temperature on width index
Path height tests revealed an inverse relationship between 16°C tests produced significantly thicker line widths than
path height and line width. A significant difference was all other tests far above the theoretical line width. At above
found between all tested line widths (0.3, 0.35, and room temperature (23°C, 30°C, and 37°C), all produced
0.4 mm) (Figure 2A). The 0.45 mm test was unable to similar results which were closer to the theoretical line
form a print with cohesive lines for measurement. These width (Figure 2D). Results of higher temperatures
tests confirmed the previous hypothesis. Future testing may were unexpected given the relationship between PL 127
benefit from expanding intervals at the expense of time and viscosity and temperature. Higher viscosity was expected
material to find the exact point at which prints begin to fail. to lead to thinner lines, but in these tests, that was not
the case. However, 23°C tests did have a higher standard
3.3. Effects of nozzle gauge on width index deviation (0.032) than 30 and 37°C tests (0.199 and 0.022,
Nozzle gauge tests revealed no significant difference in respectively). This indicates that a temperature increase
line width for all test groups. All tests performed similarly was of use in reducing error in prints and creating more
with no significant differences appearing (Figure 2B). It consistent lines.
International Journal of Bioprinting (2021)–Volume 7, Issue 4 183