
Page 75 - IJB-7-4
P. 75
Avila-Ramírez, et al.
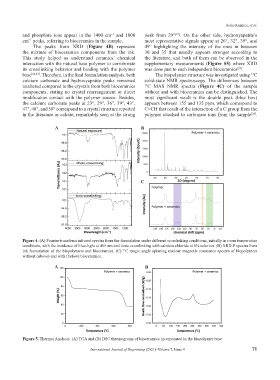
and phosphate ions appear in the 1400 cm and 1000 peak from 29° . On the other side, hydroxyapatite’s
−1
[24]
cm peaks, referring to bioceramics in the sample. most representative signals appear at 26°, 32°, 39°, and
−1
The peaks from XRD (Figure 4B) represent 49° highlighting the intensity of the ones in between
the mixture of bioceramics components from the ink. 30 and 35 that usually appears stronger according to
This study helped us understand ceramics’ chemical the literature, and both of them can be observed in the
interaction with the natural base polymer to corroborate supplementary measurements (Figure S5) where XRD
its crosslinking behavior and binding with the polymer was done just to each independent bioceramics .
[25]
base [22,23] . Therefore, in the final formulation analysis, both The biopolymer structure was investigated using C
13
calcium carbonate and hydroxyapatite peaks remained solid-state NMR spectroscopy. The differences between
unaltered compared to the crystals from both bioceramics 13 C MAS NMR spectra (Figure 4C) of the sample
components, stating no crystal rearrangement or direct without and with bioceramics can be distinguished. The
modification contact with the polymer source. Besides, most significant result is the double peak (blue box)
the calcium carbonate peaks at 23°, 29°, 36°, 39°, 43°, appears between 155 and 135 ppm, which correspond to
47°, 48°, and 58° correspond to a crystal structure reported C=CH that result of the interaction of a C group from the
in the literature as calcite, remarkably seen at the strong polymer attached to carbonate ions from the sample .
[26]
A B
C
Figure 4. (A) Fourier-transform infrared spectra from the formulation under different crosslinking conditions, initially in room temperature
conditions, with the incidence of blue-light at 405 nm and ionic-crosslinking with calcium chloride at 6% solution. (B) XRD-P spectra from
ink formulation of the biopolymers and bioceramics. (C) C magic angle spinning nuclear magnetic resonance spectra of biopolymers
13
without (above) and with (below) bioceramics.
A B
Figure 5. Thermal Analysis. (A) TGA and (B) DSC thermograms of bioceramics incorporated in the biopolymer base.
International Journal of Bioprinting (2021)–Volume 7, Issue 4 71