
Page 129 - IJB-8-4
P. 129
Park, et al.
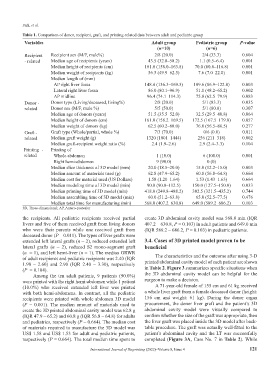
Table 1. Comparison of donor, recipient, graft, and printing-related data between adult and pediatric group
Variables Adult group Pediatric group P‑value
(n=10) (n=6)
Recipient Recipient sex (M/F, male%) 2/8 (20.0) 2/4 (33.3) 0.604
- related Median age of recipients (years) 43.5 (32.8–58.2) 1.1 (0.5–6.4) 0.001
Median height of recipients (cm) 161.0 (158.0–163.8) 70.0 (60.8–116.8) 0.001
Median weight of recipients (kg) 56.5 (49.9–62.5) 7.6 (7.0–22.0) 0.001
Median length of (mm)
AP right liver fossa 148.4 (136.3–169.3) 109.6 (86.9–122.8) 0.003
Lateral right liver fossa 86.0 (80.1–96.9) 51.1 (48.2–65.2) 0.002
AP midline 96.4 (74.1–114.3) 75.8 (62.5–79.9) 0.083
Donor - Donor type (Living/deceased, living%) 2/8 (20.0) 5/1 (83.3) 0.035
related Donor sex (M/F, male %) 5/5 (50.0) 5/1 (80.0) 0.307
Median age of donors (years) 51.5 (35.5–52.0) 32.5 (29.5–40.8) 0.064
Median height of donors (cm) 161.0 (158.2–169.5) 172.5 (167.5–179.0) 0.057
Median weight of donors (kg) 62.5 (60.2–68.0) 76.0 (56.5–86.5) 0.277
Graft - Graft type (Whole/partial, whole %) 7/3 (70.0) 0/6 (0.0) 0.011
related Median graft weight (g) 1320 (1001–1444) 256 (211–318) 0.002
Median graft-recipient weight ratio (%) 2.4 (1.9–2.6) 2.9 (2.4–3.3) 0.104
Printing - Printing of
related Whole abdomen 1 (10.0) 6 (100.0) 0.001
Right hemi-abdomen 9 (90.0) 0 (0)
Median slice thickness of 3D model (mm) 20.0 (18.5–20.0) 15.0 (12.2–15.0) 0.003
Median amount of materials used (g) 62.8 (47.9–65.2) 60.8 (56.8–64.8) 0.664
Median cost for material used (US Dollars) 1.58 (1.20–1.64) 1.53 (1.43–1.63) 0.664
Median modeling time of 3D model (min) 90.0 (90.0–112.5) 150.0 (127.5–150.0) 0.033
Median printing time of 3D model (min) 418.0 (249.8–488.2) 382.5 (321.5–435.2) 0.744
Median assembling time of 3D model (min) 60.0 (51.2–63.8) 65.0 (52.5–77.5) 0.476
Median total time for manufacturing (min) 568.0 (407.2–630.8) 649.0 (589.2–686.2) 0.103
3D, Three-dimensional; AP, Antero-posterior
the recipients. All pediatric recipients received partial create 3D abdominal cavity model was 568.0 min (IQR
livers and five of them received graft from living donors 407.2 – 630.8, P = 0.103) in adult patients and 649.0 min
who were their parents while one received graft from (IQR 589.2 – 686.2, P = 0.103) in pediatric patients.
deceased donor (P = 0.011). The types of liver grafts were
extended left lateral grafts (n = 2), reduced extended left 3.4. Cases of 3D printed model proven to be
lateral grafts (n = 2), reduced S2 mono-segment graft beneficial
(n = 1), and left hemi-liver (n = 1). The median GRWR The characteristics and the outcome after using 3-D
of adult recipients and pediatric recipients was 2.40 (IQR
1.90 – 2.60) and 2.90 (IQR 2.40 – 3.30), respectively printed abdominal cavity model of each patient are shown
(P = 0.104). in Table 2. Figure 3 summarizes specific situations when
Among the ten adult patients, 9 patients (90.0%) the 3D abdominal cavity model can be helpful for the
were printed with the right hemi-abdomen while 1 patient surgeon to make a decision.
(10.0%) who received extended left liver was printed A 71-year-old female of 155 cm and 61 kg received
with both hemi-abdomens. In contrast, all the pediatric a whole liver graft from a female deceased donor (height:
recipients were printed with whole abdomen 3D model 156 cm and weight: 61 kg). During the donor organ
(P = 0.001). The median amount of materials used to procurement, the donor liver graft and the patient’s 3D
create the 3D printed abdominal cavity model was 62.8 g abdominal cavity model were visually compared to
(IQR 47.9 – 65.2) and 60.8 g (IQR 56.8 – 64.8) for adults confirm whether the size of the graft was appropriate, then
and pediatrics, respectively (P = 0.664). The median cost the liver graft was placed inside the 3D model after back-
of materials required to manufacture the 3D model was table procedure. The graft was actually well-fitted to the
US$ 1.58 and US$ 1.53 for adult and pediatric patients, patient’s abdominal cavity and the LT was successfully
respectively (P = 0.664). The total median time spent to completed (Figure 3A, Case No. 7 in Table 2). While
International Journal of Bioprinting (2022)–Volume 8, Issue 4 121