
Page 51 - IJB-9-3
P. 51
International Journal of Bioprinting Curved cell-guided structures printed by FDM
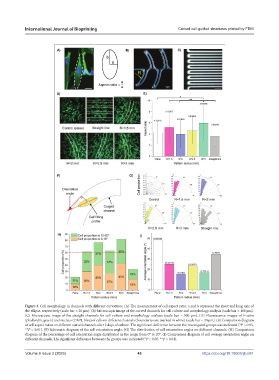
Figure 3. Cell morphology in channels with different curvatures. (A) The measurement of cell aspect ratio; a and b represent the short and long axis of
the ellipse, respectively (scale bar = 20 μm). (B) Microscopic image of the curved channels for cell culture and morphology analysis (scale bar = 100 μm).
(C) Microscopic image of the straight channels for cell culture and morphology analysis (scale bar = 500 μm). (D) Fluorescence images of F-actin
( phalloidin, green) and nucleus (DAPI, blue) of cells on different channels (boundaries are marked in white) (scale bar = 20 μm). (E) Comparison diagram
of cell aspect ratios on different curved channels after 2 days of culture. The significant difference between the investigated groups was indicated (*P < 0.05,
**P < 0.01). (F) Schematic diagram of the cell orientation angle. (G) The distribution of cell orientation angles on different channels. (H) Comparison
diagram of the percentage of cell orientation angle distributed in the range from 0° to 20°. (I) Comparison diagram of cell average orientation angle on
different channels. The significant difference between the groups was indicated (*P < 0.05, **P < 0.01).
Volume 9 Issue 3 (2023) 43 https://doi.org/10.18063/ijb.681