
Page 52 - IJB-9-3
P. 52
International Journal of Bioprinting Curved cell-guided structures printed by FDM
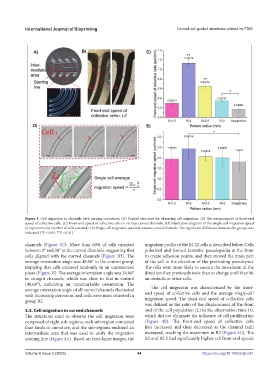
Figure 4. Cell migration in channels with varying curvatures. (A) Printed structure for observing cell migration. (B) The measurement of front-end
speed of collective cells. (C) Front-end speed of collective cells in various curved channels. (D) Illustration diagram of the single-cell migration speed
(n represents the number of cells counted). (E) Single-cell migration speed in various curved channels. The significant difference between the groups was
indicated (*P < 0.05, **P < 0.01).
channels (Figure 3G). More than 60% of cells oriented migration profile of the M-22 cells is described below. Cells
between 0° and 20° in the curved channels, suggesting that polarized and formed tentative pseudopodia at the front
cells aligned with the curved channels (Figure 3H). The to create adhesion points, and then moved the main part
average orientation angle was 48.68° in the control group, of the cell in the direction of the protruding pseudopod.
implying that cells oriented randomly in an unpatterned The cells were more likely to sustain the movement in the
plane (Figure 3I). The average orientation angle was 34.86° direction they previously took than to change until they hit
in straight channels, which was close to that in control an obstacle or other cells.
(48.68°), indicating an unremarkable orientation. The
average orientation angle of all curved channels fluctuated The cell migration was characterized by the front-
with increasing curvature, and cells were most oriented in end speed of collective cells and the average single-cell
group R2. migration speed. The front-end speed of collective cells
was defined as the ratio of the displacement of the front
3.3. Cell migration in curved channels end of the cell population (L) to the observation time (t),
The structures used to observe the cell migration were which did not eliminate the influence of cell proliferation
composed of eight sub-regions, each sub-region contained (Figure 4B). The front-end speed of collective cells
four kinds of curvature, and the sub-regions enclosed an first increased and then decreased as the channel radii
intermediate area that was used to unify the migration increased, reaching the maximum in R2 (Figure 4C). The
starting line (Figure 4A). Based on time-lapse images, the R2 and R2.5 had significantly higher cell front-end speeds
Volume 9 Issue 3 (2023) 44 https://doi.org/10.18063/ijb.681