
Page 61 - IJB-9-4
P. 61
International Journal of Bioprinting Machine learning and 3D bioprinting
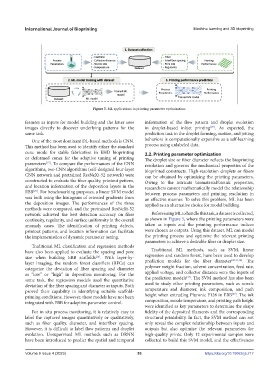
Figure 5. ML applications in printing parameter optimization.
features as inputs for model building and the latter uses information of the flow pattern and droplet evolution
images directly to discover underlying patterns for the in droplet-based inkjet printing . As expected, the
[29]
same task. prediction task in the droplet forming, motion, and jetting
One of the most dominant DL-based methods is CNN. behaviors is computationally expensive as a self-learning
This method has been used to identify either the standard process using unlabeled data.
cone mode for stable fabrication in EHD bioprinting 2.2. Printing parameter optimization
or deformed cones for the adaptive tuning of printing The droplet size or fiber diameter reflects the bioprinting
parameters . To compare the performances of the CNN resolution and governs the mechanical properties of the
[15]
algorithms, two CNN algorithms (self-designed four-layer bioprinted constructs. High-resolution droplets or fibers
CNN network and pretrained ResNeXt-52 network) were can be obtained by optimizing the printing parameters.
constructed to evaluate the fiber quality, printout pattern, Owing to the intricate biomaterial/bioink properties,
and location information of the deposition layers in the researchers cannot mathematically model the relationship
EBB . For benchmarking purposes, a linear SVM model between process parameters and printing resolution in
[25]
was built using the histogram of oriented gradients from an effective manner. To solve this problem, ML has been
the deposition images. The performances of the three applied as an alternative choice for model building.
methods were compared, and the pretrained ResNeXt-52
network achieved the best detection accuracy on fiber Before using ML to handle this task, a dataset is collected,
continuity, regularity, and surface uniformity in the overall as shown in Figure 5, where the printing parameters were
anomaly cases. The identification of printing defects, taken as inputs and the printing performance indices
printout patterns, and location information can facilitate were chosen as outputs. Using this dataset, ML can model
the implementation of dynamic parameter tuning. the printing process and optimize the relevant printing
parameters to achieve a desirable fiber or droplet size.
Traditional ML classification and regression methods
have also been applied to evaluate the spacing and pore Traditional ML methods, such as SVM, linear
[26]
size when building EBB scaffolds . With layer-by- regression and random forest, have been used to develop
layer imaging, the random forest classifiers (RFCs) can prediction models for the fiber diameter [26,33,34] . The
categorize the deviation of fiber spacing and diameter polymer weight fraction, solvent concentration, feed rate,
as “low” or “high” in deposition monitoring. For the applied voltage, and collector distance were the inputs of
[34]
same task, the regression models used the quantitative the prediction models . The SVM method has also been
deviation of the fiber spacing and diameter as inputs. Both used to study other printing parameters, such as nozzle
proved their capability in identifying suitable scaffold- temperature and diameter, ink composition, and path
[27]
printing conditions. However, these models have not been height when extruding Pluronic F128 in EBB . The ink
integrated with EBB for adaptive-parameter control. composition, nozzle temperature, and printing path height
were identified as key parameters to determine the shape
For in situ process monitoring, it is relatively easy to fidelity of the deposited filaments and the corresponding
label the captured images quantitatively or qualitatively, structural printability. In fact, the SVM method can not
such as fiber quality, diameter, and interfiber spacing. only reveal the complex relationship between inputs and
However, it is difficult to label flow patterns and droplet outputs but also optimize the relevant parameters for
evolution. Unsupervised ML methods such as DRNN high-quality prints. Only 12 experimental samples were
have been introduced to predict the spatial and temporal collected to build this SVM model, and the effectiveness
Volume 9 Issue 4 (2023) 53 https://doi.org/10.18063/ijb.717