
Page 89 - IJB-9-4
P. 89
International Journal of Bioprinting Laser transfer for CTC isolation
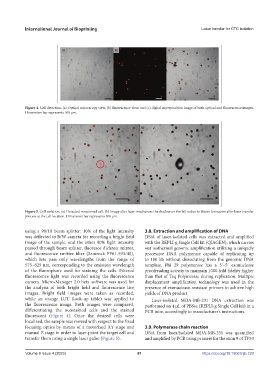
Figure 4. Cell detection. (a) Optical microscopy view, (b) fluorescence view, and (c) digital superposition image of both optical and fluorescence images.
Dimension bar represents 100 µm.
Figure 5. Cell isolation. (a) Detected nonstained cell. (b) Image after laser irradiation: the shadow on the left is due to blister formation after laser transfer
process at the cell location. Dimension bar represents 100 µm.
using a 90/10 beam splitter: 10% of the light intensity 3.8. Extraction and amplification of DNA
was deflected to B/W camera for recording a bright field DNA of laser-isolated cells was extracted and amplified
image of the sample, and the other 90% light intensity with the REPLI-g Single Cell kit (QIAGEN), which carries
passed through beam splitter, fluoresce dichroic mirror, out isothermal genome amplification utilizing a uniquely
and fluorescence emitter filter (Semrock FF01-593/40), processive DNA polymerase capable of replicating up
which lets pass only wavelengths from the range of to 100 kb without dissociating from the genomic DNA
575–625 nm, corresponding to the emission wavelength template. Phi 29 polymerase has a 3ʹ–5ʹ exonuclease
of the fluorophore used for staining the cells. Filtered proofreading activity to maintain 1000-fold fidelity higher
fluorescence light was recorded using the fluorescence than that of Taq Polymerase during replication. Multiple
camera. Micro-Manager 2.0 beta software was used for displacement amplification technology was used in the
the analysis of both bright field and fluorescence live presence of exonuclease-resistant primers to achieve high
images. Bright field images were taken as recorded, yields of DNA product.
while an orange LUT (look-up table) was applied to Laser-isolated MDA-MB-231 DNA extraction was
the fluorescence image. Both images were compared, performed on 4 μL of PBSsc (REPLI-g Single Cell kit) in a
differentiating the nonstained cells and the stained PCR tube, accordingly to manufacturer’s instructions.
fluorescent (Figure 4). Once the desired cells were
localized, the sample was moved with respect to the fixed
focusing optics by means of a motorized XY stage and 3.9. Polymerase chain reaction
manual Z stage in order to laser-point the target cell and DNA from laser/isolated MDA-MB-231 was quantified
transfer them using a single laser pulse (Figure 5). and amplified by PCR using primers for the exon 9 of TP53
Volume 9 Issue 4 (2023) 81 https://doi.org/10.18063/ijb.720