
Page 293 - v11i4
P. 293
International Journal of Bioprinting Dual tuning of 3D-printed SilMA hydrogel
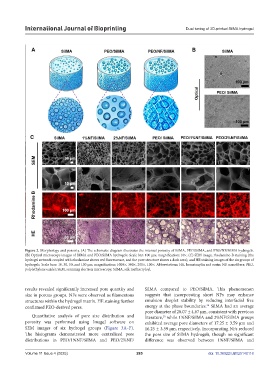
Figure 2. Morphology and porosity. (A) The schematic diagram illustrates the internal porosity of SilMA, PEO/SilMA, and PEO/NF/SilMA hydrogels.
(B) Optical microscope images of SilMA and PEO/SilMA hydrogels. Scale bar: 100 µm; magnification: 10×. (C) SEM image, rhodamine-B staining (the
hydrogel network coupled with rhodamine shows red fluorescence, and the pore structure shows a dark area), and HE staining images of the six groups of
hydrogels. Scale bars: 10, 30, 50, and 100 µm; magnification: 1000×, 300×, 200×, 100×. Abbreviations: HE, hematoxylin and eosin; NF, nanofibers; PEO,
poly(ethylene oxide); SEM, scanning electron microscopy; SilMA, silk methacryloyl.
results revealed significantly increased pore quantity and SilMA compared to PEO/SilMA. This phenomenon
size in porous groups. NFs were observed as filamentous suggests that incorporating short NFs may enhance
structures within the hydrogel matrix. HE staining further emulsion droplet stability by reducing interfacial free
34
confirmed PEO-derived pores. energy at the phase boundaries. SilMA had an average
pore diameter of 20.07 ± 4.67 µm, consistent with previous
Quantitative analysis of pore size distribution and literature, while 1%NF/SilMA and 2%NF/SilMA groups
20
porosity was performed using ImageJ software on exhibited average pore diameters of 17.25 ± 3.59 µm and
SEM images of six hydrogel groups (Figure 3A–F). 16.25 ± 3.59 µm, respectively. Incorporating NFs reduced
The histograms demonstrated more centralized pore the pore size of SilMA hydrogels, though no significant
distributions in PEO/1%NF/SilMA and PEO/2%NF/ difference was observed between 1%NF/SilMA and
Volume 11 Issue 4 (2025) 285 doi: 10.36922/IJB025140118