
Page 296 - v11i4
P. 296
International Journal of Bioprinting Dual tuning of 3D-printed SilMA hydrogel
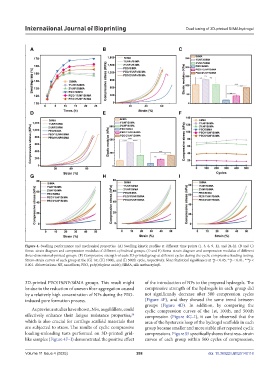
Figure 4. Swelling performance and mechanical properties. (A) Swelling kinetic profiles at different time points (1, 3, 6, 9, 12, and 24-h). (B and C)
Stress–strain diagram and compression modulus of different cylindrical groups. (D and E) Stress–strain diagram and compression modulus of different
three-dimensional-printed groups. (F) Compressive strength of each 3D-printed group at different cycles during the cyclic compressive loading testing.
Stress–strain curves of each group at the (G) 1st, (H) 100th, and (I) 500th cycle, respectively. Note: Statistical significance at *p < 0.05, **p < 0.01, ***p <
0.001. Abbreviations: NF, nanofibers; PEO, poly(ethylene oxide); SilMA, silk methacryloyl .
3D-printed PEO/1%NF/SilMA groups. This result might of the introduction of NFs to the prepared hydrogels. The
be due to the reduction of uneven fiber aggregation caused compressive strength of the hydrogels in each group did
by a relatively high concentration of NFs during the PEO- not significantly decrease after 500 compression cycles
induced pore formation process. (Figure 4F), and they showed the same trend between
groups (Figure 4D). In addition, by comparing the
As previous studies have shown, NFs, as gel fillers, could cyclic compression curves of the 1st, 100th, and 500th
effectively enhance their fatigue resistance properties, compression (Figure 4G–I), it can be observed that the
24
which is also crucial for cartilage scaffold materials that area of the hysteresis loop of the hydrogel scaffolds in each
are subjected to stress. The results of cyclic compressive group became smaller and more stable after repeated cyclic
loading-unloading tests performed on 3D-printed grid- compressions. Figure S5 specifically shows the stress–strain
like samples (Figure 4F–I) demonstrated the positive effect curves of each group within 500 cycles of compression,
Volume 11 Issue 4 (2025) 288 doi: 10.36922/IJB025140118