
Page 299 - v11i4
P. 299
International Journal of Bioprinting Dual tuning of 3D-printed SilMA hydrogel
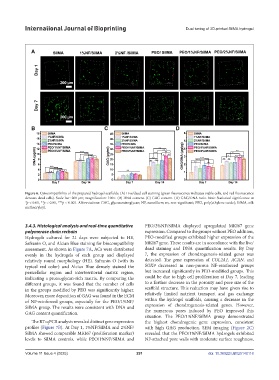
Figure 6. Cytocompatibility of the prepared hydrogel scaffolds. (A) Live/dead cell staining (green fluorescence indicates viable cells, and red fluorescence
denotes dead cells). Scale bar: 200 µm; magnification: 100×. (B) DNA content. (C) GAG content. (D) GAG/DNA ratio. Note: Statistical significance at
*p < 0.05, **p < 0.01, ***p < 0.001. Abbreviations: GAG, glycosaminoglycan; NF, nanofibers; ns, non-significant; PEO, poly(ethylene oxide); SilMA, silk
methacryloyl.
3.4.3. Histological analysis and real-time quantitative PEO/2%NF/SilMA displayed upregulated MKI67 gene
polymerase chain rechain expression. Compared to the groups without PEO addition,
Hydrogels cultured for 21 days were subjected to HE, PEO-modified groups exhibited higher expression of the
Safranin O, and Alcian Blue staining for biocompatibility MKI67 gene. These results are in accordance with the live/
assessment. As shown in Figure 7A, ACs were distributed dead staining and DNA quantification results. By Day
evenly in the hydrogels of each group and displayed 7, the expression of chondrogenesis-related genes was
relatively round morphology (HE). Safranin O (with its detected. The gene expression of COL2A1, ACAN, and
typical red color) and Alcian Blue densely stained the SOX9 decreased in non-porous NF-reinforced groups
pericellular region and interterritorial matrix region, but increased significantly in PEO-modified groups. This
indicating a proteoglycan-rich matrix. By comparing the could be due to high cell proliferation at Day 7, leading
different groups, it was found that the number of cells to a further decrease in the porosity and pore size of the
in the groups modified by PEO was significantly higher. scaffold structure. This reduction may have given rise to
Moreover, more deposition of GAG was found in the ECM relatively limited nutrient transport and gas exchange
of NF-reinforced groups, especially for the PEO/1%NF/ within the hydrogel scaffolds, causing a decrease in the
SilMA group. The results were consistent with DNA and expression of chondrogenesis-related genes. However,
GAG content quantification. the numerous pores induced by PEO improved this
situation. The PEO/1%NF/SilMA group demonstrated
The RT-qPCR analysis revealed distinct gene expression the highest chondrogenic gene expression, consistent
profiles (Figure 7B). At Day 1, 1%NF/SilMA and 2%NF/ with high GAG production. SEM imaging (Figure 2C)
SilMA showed comparable MKI67 (proliferation marker) revealed that the PEO/1%NF/SilMA hydrogels exhibited
levels to SilMA controls, while PEO/1%NF/SilMA and NF-attached pore walls with moderate surface roughness,
Volume 11 Issue 4 (2025) 291 doi: 10.36922/IJB025140118