Page 235 - IJOCTA-15-4
P. 235

Data-driven optimization and parameter estimation for an epidemic model


                                                              R
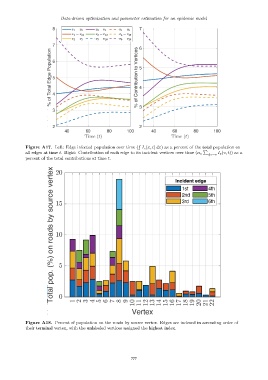
            Figure A17. Left: Edge infected population over time ( I e (x, t) dx) as a percent of the total population on
                                                                                           P
                                                                                                  I
                                                                                             e|e∼v e (v, t)) as a
            all edges at time t. Right: Contribution of each edge to its incident vertices over time (α v
            percent of the total contributions at time t.


            Figure A18. Percent of population on the roads by source vertex. Edges are indexed in ascending order of
            their terminal vertex, with the unlabeled vertices assigned the highest index.


                                                           777
   230   231   232   233   234   235   236   237   238