
Page 233 - IJOCTA-15-4
P. 233
Data-driven optimization and parameter estimation for an epidemic model
Table 4. Signed mean EE, showing the directionality of the elementary effects.
Peak Infection Rate Time of Peak Cumulative Infections
Poland Warszawa Pozna´n Poland Warszawa Pozna´n Poland Warszawa Pozna´n
β 1,935 2,342 631 -3.0 387 114 16,242 11 -64
η -2,100 -6,206 -1,750 2.3 -417 -122 -39,370 19 32
α -1.5 23 5.3 -0.07 4.5 1.4 -8,907 -3.9 -1.4
λ -0.02 -10 -2.2 0.06 -3.5 -1.1 3,526 2.9 1.2
v ≈ 0 ≈ 0 ≈ 0 ≈ 0 ≈ 0 ≈ 0 0.5 ≈ 0 ≈ 0
d -39 -22 -6.3 -9.3 -10 -3.4 3,467 0.06 -0.7
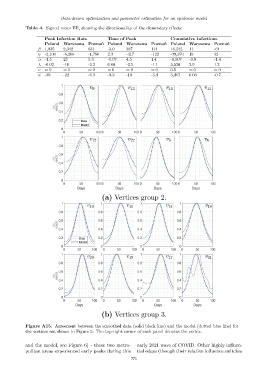
Figure A15. Agreement between the smoothed data (solid black line) and the model (dotted blue line) for
the vertices not shown in Figure 5. The top-right corner of each panel denotes the vertex.
and the model, see Figure 6) - these two metro- early 2021 wave of COVID. Other highly influen-
politan areas experienced early peaks during this tial edges (though their relative influence switches
775