Page 229 - IJOCTA-15-4
P. 229

Data-driven optimization and parameter estimation for an epidemic model
            Table 3. Populated vertices along with their initial conditions and parameter values. The skipping parameter
             v
            v is scaled by c v = 0.306 at all vertices, including the unpopulated ones, while the diffusion coefficient is kept
            constant for all edges at d e = 0.09.
                                                      c
                            Vertex                   S(0)   I(0)               β · S(0)   η     α       λ
                           1 - Pozna´n             454,442  670                0.41       0.33  0.88    0.08
                          2 - Wroc law             571,100  504                0.43       0.34  0.88    0.05
             3 - Katowice, Sosnowiec, Zabrze, & Bytom  704,112  570            0.43       0.34  0.95    0.05
                          4 - Krak´ow              701,725  470                0.44       0.34  0.88    0.05
                          5 - Rzesz´ow             186,080  230                0.46       0.36  0.55    0.05
                           6 - Radom               186,894  124                0.44       0.34  0.80    0.05
                            7 -  L´od´z            581,453  600                0.44       0.36  0.60    0.06
                     8 - Warszawa (Warsaw)         1,610,924 1,941             0.45       0.36  0.886   0.05
                      9 - Gda´nsk & Gdynia         629,924  1,204              0.46       0.39  0.65    0.05
                        10 - Bielsko-Bia la        152,621  123                0.41       0.31  0.88    0.05
                          11 - Lublin              308,636  331                0.45       0.39  0.88    0.05
                         12 - Bia lystok           264,085  367                0.45       0.39  0.88    0.05
                          13 - Szczecin            339,467  435                0.46       0.38  0.70    0.10
                           14 - Kielce             175,855  152                0.42       0.32  0.88    0.05
                        15 - Czestochowa           193,876  149                0.45       0.36  0.88    0.05
                         16 - Bydgoszcz            291,460  613                0.41       0.35  0.80    0.08
                          17 - Suwa lki             65,475  51                 0.46       0.38  0.88    0.05
                        18 - Zielona G´ora         127,869  216                0.50       0.43  0.88    0.05
                    19 - Gorz´ow Wielkopolski      106,383  196                0.51       0.43  0.88    0.05
                          20 - Rybnik              122,801  62                 0.42       0.33  0.88    0.05
                            ´
                        21 - Swinouj´scie           35,295  54                 0.50       0.41  0.88    0.05
                           22 - Toru´n             171,744  374                0.44       0.39  0.88    0.06


                                                                                   v
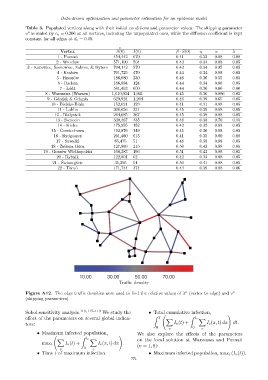
            Figure A12. The edge traffic densities were used to find the relative values of λ (vertex to edge) and v v
            (skipping parameters).


            Sobol sensitivity analysis. 110,117–119  We study the  • Total cumulative infection,
                                                                                                      !
            effect of the parameters on several global indica-       Z  T  X         Z  l e X
                                                                              I v (t) +      I e (x, t) dx  dt.
            tors:
                                                                      0     v          0   e
                  • Maximum infected population,              We also explore the effects of the parameters
                                                      !
                                     Z
                          X            l e X                  on the local solution at Warszawa and Pozna´n
                    max t     I v (t) +      I e (x, t) dx .  (v = 1, 8):
                            v         0   e
                  • Time t of maximum infection.                   • Maximum infected population, max t (I v (t)).
                                                           771
   224   225   226   227   228   229   230   231   232   233   234