
Page 234 - IJOCTA-15-4
P. 234
H. Kravitz et al. / IJOCTA, Vol.15, No.4, pp.750-778 (2025)
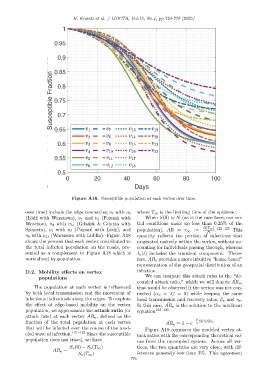
Figure A16. Susceptible population at each vertex over time.
over time) include the edge connecting v 7 with v 8 where T ∞ is the limiting time of the epidemic.
( L´od´z with Warszawa), v 1 and v 2 (Pozna´n with When S(0) ≈ N (as is the case here; our ini-
Wroc law), v 9 with v 13 (Gda´nsk & Gdynia with tial conditions make up less than 0.25% of the
Szczecin), v 1 with v 7 (Pozna´n with L´od´z), and population), AR ≈ r ∞ := R(T ∞) 123–125 This
.
N
v 8 with v 11 (Warszawa with Lublin). Figure A18 quantity reflects the portion of infections that
shows the percent that each vertex contributed to originated natively within the vertex, without ac-
the total infected population on the roads, pre- counting for individuals passing through, whereas
sented as a complement to Figure A18 which is I v (t) includes the transient component. There-
normalized by population. fore, AR v provides a more intuitive “home-based”
representation of the geospatial distribution of an
D.2. Mobility effects on vertex infection.
We can compare this attack ratio to the “de-
populations
˜
coupled attack ratio,” which we will denote AR v ,
The population at each vertex is influenced that would be observed if the vertex was not con-
v
by both local transmission and the movement of nected (α v = λ = 0) while keeping the same
e
infectious individuals along the edges. To explore local transmission and recovery rates, β v and η v .
˜
the effect of edge-based mobility on the vertex In this case, AR v is the solution to the nonlinear
population, we approximate the attack ratio (or equation 123–125
attack rate) at each vertex AR v , defined as the
β ˜
˜
fraction of the total population at each vertex AR v = 1 − e − S(0)AR v
η
that will be infected over the course of the mod- Figure A19 compares the modeled vertex at-
eled wave of infection. 121–123 Since the susceptible tack ratios with the corresponding theoretical val-
population does not travel, we have ues from the uncoupled system. Across all ver-
S v (0) − S v (T ∞ ) tices, the two quantities are very close, with dif-
AR v =
S v (T ∞ ) ferences generally less than 3%. This agreement
776