
Page 101 - IJPS-10-2
P. 101
International Journal of
Population Studies Household food insecurity in urban areas
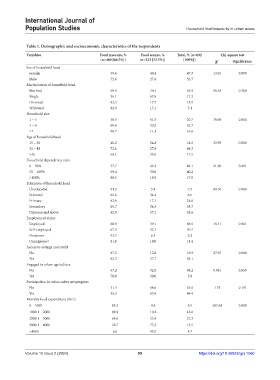
Table 1. Demographic and socioeconomic characteristics of the respondents
Variables Food insecure, % Food secure, % Total, % (n=692 Chi‑square test
(n=460 [66.5%]) (n=232 [33.5%]) [100%]) χ 2 Significance
Sex of household head
Female 59.6 40.4 47.3 13.01 0.000
Male 72.6 27.4 52.7
Marital status of household head
Married 69.9 30.1 63.9 66.48 0.308
Single 36.1 63.9 17.2
Divorced 82.3 17.7 13.9
Widowed 82.9 17.1 5.1
Household size
1 – 3 38.5 61.5 20.7 78.00 0.000
4 – 6 69.8 30.2 62.7
≥7 88.7 11.3 16.6
Age of household head
15 – 30 45.2 54.8 18.2 32.95 0.000
31 – 45 72.6 27.4 64.3
>45 66.1 33.9 17.5
Household dependency ratio
0 – 50% 57.7 42.3 42.1 21.90 0.001
50 – 100% 69.4 30.6 40.2
>100% 80.5 19.5 17.8
Education of household head
Uneducated 94.2 5.8 7.5 80.30 0.000
Informal 65.6 34.4 4.6
Primary 82.9 17.1 24.6
Secondary 65.7 34.3 38.7
Diploma and above 42.9 57.1 24.6
Employment status
Employed 60.9 39.1 46.5 15.41 0.001
Self-employed 67.3 32.7 39.7
Pensioner 93.7 6.3 2.3
Unemployed 81.0 19.0 11.4
Access to savings and credit
No 87.2 12.8 16.9 27.07 0.000
Yes 62.3 37.7 83.1
Engaged in urban agriculture
No 67.2 32.8 94.2 0.041 0.859
Yes 70.0 30.0 5.8
Participation in urban safety net program
No 31.4 68.6 55.6 1.71 0.191
Yes 36.2 63.8 44.4
Monthly food expenditure (Birr)
0 – 1000 95.2 4.8 9.5 297.68 0.000
1000.1 – 2000 89.8 10.2 45.0
2000.1 – 3000 64.6 35.4 27.3
3000.1 – 4000 22.7 77.3 13.5
>4000 6.5 93.5 4.7
Volume 10 Issue 2 (2024) 95 https://doi.org/10.36922/ijps.1060