
Page 102 - IJPS-10-2
P. 102
International Journal of
Population Studies Household food insecurity in urban areas
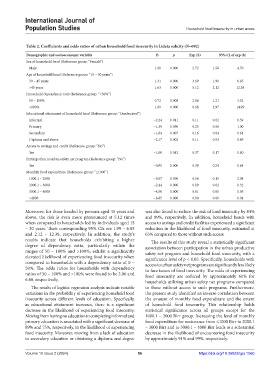
Table 2. Coefficients and odds ratios of urban household food insecurity in Lideta subcity (N=692)
Demographic and socioeconomic variable B p Exp (b) 95% CI of exp (b)
Sex of household head (Reference group: “Female”)
Male 1.00 0.000 2.72 1.58 4.70
Age of household head (Reference group: “15 – 30 years”)
30 – 45 years 1.31 0.000 3.69 1.99 6.85
>45 years 1.63 0.000 5.12 2.12 12.38
Household dependency ratio (Reference group: “<50%”)
50 – 100% 0.72 0.008 2.06 1.21 3.52
>100% 1.89 0.000 6.68 2.97 14.99
Educational attainment of household head (Reference group: “Uneducated”)
Informal −2.24 0.011 0.11 0.02 0.59
Primary −1.39 0.050 0.25 0.06 1.00
Secondary −1.84 0.007 0.16 0.04 0.61
Diploma and above −2.17 0.002 0.11 0.03 0.45
Access to savings and credit (Reference group: “No”)
Yes −1.00 0.012 0.37 0.17 0.80
Participation in urban safety net program (Reference group: “No”)
Yes −0.95 0.000 0.39 0.24 0.64
Monthly food expenditure (Reference group: “≤1000”)
1000.1 – 2000 −0.57 0.390 0.56 0.15 2.08
2000.1 – 3000 −2.44 0.000 0.09 0.02 0.32
3000.1 – 4000 −4.50 0.000 0.01 0.00 0.05
>4000 −6.85 0.000 0.00 0.00 0.01
Moreover, for those headed by persons aged 45 years and was also found to reduce the risk of food insecurity by 84%
above, the risk is even more pronounced at 5.12 times and 89%, respectively. In addition, household heads with
when compared to households led by individuals aged 15 access to savings and credit facilities experienced a significant
– 30 years. Their corresponding 95% CIs are 1.99 – 6.85 reduction in the likelihood of food insecurity, estimated at
and 2.12 – 12.38, respectively. In addition, the study’s 63% compared to those without such access.
results indicate that households exhibiting a higher The results of this study reveal a statistically significant
degree of dependency ratio, particularly within the association between participation in the urban productive
ranges of 50 – 100% and >100%, exhibit a significantly safety net program and household food insecurity, with a
elevated likelihood of experiencing food insecurity when significance level of p < 0.05. Specifically, households with
compared to households with a dependency ratio of 0 – access to urban safety net programs are significantly less likely
50%. The odds ratios for households with dependency to face issues of food insecurity. The odds of experiencing
ratios of 50 – 100% and >100% were found to be 2.06 and food insecurity are reduced by approximately 61% for
6.68, respectively. households utilizing urban safety net programs compared
The results of logistic regression analysis indicate notable to those without access to such programs. Furthermore,
variations in the probability of experiencing household food the present study identified an inverse correlation between
insecurity across different levels of education. Specifically, the amount of monthly food expenditure and the extent
as educational attainment increases, there is a significant of household food insecurity. This relationship holds
decrease in the likelihood of experiencing food insecurity. statistical significance across all groups except for the
Moving from having no education to completing informal and 1000.1 – 2000 Birr group. Increasing the level of monthly
primary education is associated with a significant decrease of food expenditure for sustenance from ≤1000 Birr to 2000.1
89% and 75%, respectively, in the likelihood of experiencing – 3000 Birr and to 3000.1 – 4000 Birr leads to a substantial
food insecurity. Moreover, moving from a lack of education decrease in the likelihood of encountering food insecurity
to secondary education or obtaining a diploma and degree by approximately 91% and 99%, respectively.
Volume 10 Issue 2 (2024) 96 https://doi.org/10.36922/ijps.1060