
Page 110 - IJPS-10-3
P. 110
International Journal of
Population Studies Gender differences in mental health outcomes
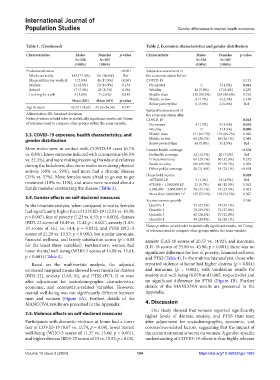
Table 1. (Continued) Table 2. Economic characteristics and gender distribution
Characteristics Males Females p‑value Characteristic Males Females p‑value
N=238 N=265 N=238 N=265
(100%) (100%) (100%) (100%)
Professional status <0.001 Subjective assessment of
Works currently 184 (77.3%) 161 (60.8%) Ref the economic status before
Housewife/never worked 7 (2.9%) 45 (17.0%) <0.001 COVID-19 0.124
Student 21 (8.8%) 29 (10.9%) 0.134 No answer 0 5 (1.9%) 0.021
Retired 17 (7.1%) 23 (8.7%) 0.194 Wealthy 14 (5.9%) 17 (6.4%) 0.235
Looking for a job 9 (3.8%) 7 (2.6%) 0.819 Middle class 213 (89.9%) 234 (88.6%) 0.162
Mean (SD) Mean (SD) p‑value Middle to low 4 (1.7%) 6 (2.3%) 0.188
Age in years 42.72 (14.62) 42.26 (16.56) 0.717 Below poverty line 6 (2.5%) 2 (0.8%) Ref
Subjective assessment of
Abbreviation: SD: Standard deviation. the economic status after
Notes: p-values in bold refer to statistically significant results. ref: Group COVID-19 0.018
of reference used to compare other groups within the same variable. No answer 4 (1.7%) 9 (3.4%) 0.016
Wealthy 0 5 (1.9%) 0.006
3.3. COVID-19 exposure, health characteristics, and Middle class 151 (63.7%) 176 (66.7%) 0.020
gender distribution Middle to low 68 (28.7%) 69 (26.1%) 0.049
Below poverty line 14 (5.9%) 5 (1.9%) Ref
More males were in contact with COVID-19 cases (6.7% Current health coverage <0.001
vs. 0.8%), knew someone infected with coronavirus (36.3% No health coverage 32 (13.5%) 20 (7.6%) Ref
vs. 22.3%), and were visiting/receiving friends and relatives Private insurance 69 (29.1%) 86 (32.6%) 0.252
during the lockdown; also, more males were doing physical Social security 108 (45.6%) 97 (36.7%) 0.034
activity (69% vs. 59%), and more had a chronic disease Other public coverage 28 (11.8%) 61 (23.1%) <0.001
(25% vs. 17%). More females were afraid to go out to get Household income 0.029
12 (4.5%)
3 (1.3%)
Ref
treatment (19% vs. 11%), and more were worried about a <675,000 LP 23 (9.7%) 41 (15.5%) 0.362
675,000 – 1,500,000 LP
family member contracting the disease (Table 3). 1,500,000 – 3,000,000 LP 76 (32.1%) 73 (27.5%) 0.022
More than 3,000,000 LP 135 (57.0%) 139 (52.5%) 0.027
3.4. Gender effects on self-declared measures
Socioeconomic quartile 0.356
In the bivariate analysis, when compared to males, females Quartile 1 55 (23.3%) 78 (30.1%)
had significantly higher fear of COVID-19 (12.03 vs. 10.58; Quartile 2 70 (29.7%) 72 (27.8%)
p = 0.007), fear of poverty (7.23 vs. 6.53; p = 0.003), distress Quartile 3 62 (26.3%) 57 (22.0%)
Quartile 4
52 (20.1%)
49 (20.8%)
(BDS-22 scores of 18.49 vs. 13.42; p < 0.001), anxiety (LAS-
10 scores of 16.1 vs. 14.4; p = 0.032), and PTSS (PCL-5 Notes: p-values in bold refer to statistically significant results. ref: Group
of reference used to compare other groups within the same variable.
scores of 21.29 vs. 13.57; p < 0.001), but similar insomnia,
financial wellness, and family satisfaction scores (p > 0.05 anxiety (LAS-10 scores of 20.57 vs. 14.92), and insomnia
for the latest three variables). Furthermore, women had (LIS-18 scores of 53.89 vs. 43.96; p < 0.001); there was no
lower mental well-being (WHO-5 scores of 14.08 vs. 15.61; significant difference for fear of poverty, financial wellness,
p < 0.001) (Table 4). and PTSS (Table 4). In the multivariate analysis, those who
Based on the multivariate analysis, the adjusted reported violence at home had higher distress (p = 0.041)
estimated marginal means showed lower means for distress and insomnia (p = 0.002), with borderline results for
(BDS-22), anxiety (LAS-10), and PTSS (PCL-5) in men anxiety and well-being (0.078 and 0.065, respectively) and
after adjustment for sociodemographic characteristics, no significant difference for PTSS (Figure 1B). Further
economic, and coronavirus-related variables. However, details of the MANCOVA results are presented in the
mental well-being was not significantly different between Appendix.
men and women (Figure 1A). Further, details of the
MANCOVA results are presented in the Appendix. 4. Discussion
Our study showed that women reported significantly
3.5. Violence effects on self-declared measures higher levels of distress, anxiety, and PTSS than men
Participants with domestic violence at home had a lower after adjustment for sociodemographic, economic, and
fear of COVID-19 (8.67 vs. 12.74; p = 0.04), lower mental coronavirus-related factors, suggesting that the impact of
well-being (WHO-5 scores of 11.37 vs. 15.06; p < 0.001), the current situation is worse on women. A gender-specific
and higher distress (BDS-22 scores of 23 vs. 15.52; p = 0.03), understanding of COVID-19 effects is thus highly relevant
Volume 10 Issue 3 (2024) 104 https://doi.org/10.36922/ijps.1985