
Page 38 - IJPS-10-3
P. 38
International Journal of
Population Studies Prenatal care in Santa Catarina, Brazil
(Cont’d...)
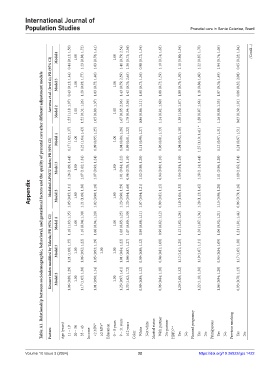
Anversa et al. (level 4); PR (95% CI) Model4 Model 3 Model 2 0.44 (0.13; 1.50) 0.43 (0.13; 1.44) 1.53 (1.18; 1.97) 1.00 1.00 1.00 1.23 (0.88; 1.72) 1.28 (0.93; 1.77) 1.52 (0.31; 1.26) 1.03 (0.76; 1.41) 1.03 (0.75; 1.40) 1.05 (0.80; 1.37) 1.00 1.00 1.00 1.41 (0.79; 2.54) 1.43 (0.79; 2.59) 1.67 (0.95; 2.96) 1.36 (0.75; 2.56) 1.42 (0.76; 2.65) 1.70 (0.94; 3.06) 0.98 (0.72; 1.34) 1.00 (0.73; 1.36) 0.86 (0.66; 1.11) 1.10 (0.74; 1.63) 1.08
Modified APNCU index; PR (95% CI) Model 4 Model 3 1.17 (1.02; 1.37) 1.26 (1.09; 1.44) 1.00 1.00 1.22 (1.04; 1.43) 1.17 (1.02; 1.34) 1.09 (0.95; 1.25) 1.07 (0.93; 1.24) 1.00 1.00 1.04 (0.86; 1.26) 1.01 (0.84; 1.22) 0.99 (0.81; 1.22) 0.96 (0.78; 1.19) 1.11 (0.98; 1.27) 1.12 (0.98; 1.28) 0.96 (0.81; 1.13) 0.94 (0.80; 1.10) 1.04 (0.92; 1.18) 1.04 (0.91; 1.18) 1.25 (1.10; 1.41) * 1.28 (1.14; 1.44) 1.12 (0.97; 1.31) 1.11 (0.96; 1.28) 1.21
Appendix Table A1. Relationship between sociodemographic, behavioral, and gestational factors and the quality of prenatal care after different adjustment models Model 2 1.05 (0.85; 1.31) 1.00 1.21 (1.08; 1.36) 1.02 (0.90; 1.16) 1.00 1.23 (0.96; 1.59) 1.23 (0.94; 1.60) 1.07 (0.94; 1.21) 0.99 (0.85; 1.15) 1.18 (1.05; 1.33) 1.28 (1.13; 1.45) 1.13 (0.98; 1.28) 0.96 (0.79; 1.16)
Kessner index modified by Takeda; PR (95% CI) Model 4 Model 3 Model 2 1.18 (1.03; 1.35) 1.21 (1.08; 1.35) 1.06 (0.88; 1.29) 1.00 1.00 1.00 1.10 (0.94; 1.30) 1.06 (0.92; 1.22) 1.17 (1.05; 1.30) 1.06 (0.94; 1.20) 1.05 (0.93; 1.19) 1.01 (0.90; 1.14) 1.00 1.00 1.00 1.00 1.03 (0.85; 1.25) 1.01 (0.84; 1.22) 1.25 (0.97; 1.61) 1.07 (0.89; 1.30) 1.04 (0.87; 1.27) 1.33 (1.02; 1.72) 0.99 (0.88; 1.11) 0.99 (0.88; 1.12) 0.99 (0.89; 1.12) 0.96 (0
Factors Age (years) 11 – 19 20 – 34 35 – 43 Income <2 MW* ≥2 MW* Education 0 – 8 years 9 – 11 years ≥12 years Color White Not white Marital status With partner No partner HRPN** Yes No Planned pregnancy Yes No Primiparous Yes No Previous smoking Yes No
Volume 10 Issue 3 (2024) 32 https://doi.org/10.36922/ijps.1422