
Page 68 - IJPS-10-3
P. 68
International Journal of
Population Studies Associated factors of child wasting in India
(DHS) website. Analysis was restricted to 75550 children interest with independent variables. Subsequently, stepwise
aged 0 – 23 months (IIPS & ICF, 2021). logistic regression analysis was conducted to identify
significant factors associated with wasting for children
2.2. Study variables aged 0 – 23 months. All statistical analyses were carried out
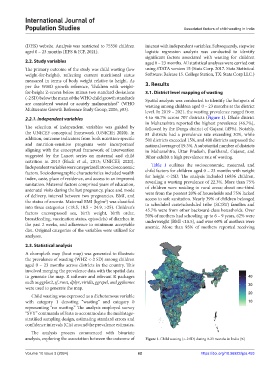
The primary outcome of the study was child wasting (low using STATA version 15 (Stata Corp. 2017. Stata Statistical
weight-for-height), reflecting current nutritional status Software: Release 15. College Station, TX: Stata Corp LLC.)
measured in terms of body weight relative to height. As
per the WHO growth reference, “children with weight- 3. Results
for-height Z-scores below minus two standard deviations 3.1. District level mapping of wasting
(-2 SD) below the mean of the WHO child growth standards Spatial analysis was conducted to identify the hotspots of
are considered wasted or acutely malnourished” (WHO wasting among children aged 0 – 23 months at the district
Multicentre Growth Reference Study Group, 2006, p83). level. In 2019 – 2021, the wasting prevalence ranged from
2.2.1. Independent variables 4 to 46.7% across 707 districts (Figure 1). Dhule district
in Maharashtra reported the highest prevalence (46.7%),
The selection of independent variables was guided by followed by the Dangs district of Gujarat (45%). Notably,
the UNICEF conceptual framework (UNICEF, 2020). In 81 districts had a prevalence rate exceeding 30%, while
addition, outcome indicators from both nutrition-specific 501 districts exceeded 15%, and 400 districts surpassed the
and nutrition-sensitive programs were incorporated national average of 19.3%. A substantial number of districts
aligning with the conceptual framework of intervention in Maharashtra, Uttar Pradesh, Jharkhand, Gujarat, and
suggested by the Lancet series on maternal and child Bihar exhibit a high prevalence rate of wasting.
nutrition in 2013 (Black et al., 2013; UNICEF, 2020).
Independent variables were categorized into socioeconomic Table 1 outlines the socioeconomic, maternal, and
factors. Sociodemographic characteristics included wealth child factors for children aged 0 – 23 months with weight
index, caste, place of residence, and access to an improved for height <-2SD. The analysis included 16836 children,
sanitation. Maternal factors comprised years of education, revealing a wasting prevalence of 22.3%. More than 75%
antenatal visits during the last pregnancy, place and mode of children were residing in rural areas; about one-third
of delivery, interval between two pregnancies, BMI, and were from the poorest 20% of households and 75% lacked
2
the status of anemia. Maternal BMI (kg/m ) was classified access to safe sanitation. Nearly 39% of children belonged
to scheduled caste/scheduled tribe (SC/ST) families and
into three categories (<18.5, 18.5 – 24.9, >25). Children’s 45.7% were from other backward-class households. Over
factors encompassed sex, birth weight, birth order, 50% of mothers had schooling up to 6 – 9 years, 62% were
breastfeeding, vaccination status, episode(s) of diarrhea in underweight (BMI <18.5), and over 60% of mothers were
the past 2 weeks, and adherence to minimum acceptable anemic. More than 93% of mothers reported receiving
diet. Original categories of the variables were utilized for
analyses.
2.3. Statistical analysis
A choropleth map (heat map) was generated to illustrate
the prevalence of wasting (WHZ <-2 SD) among children
aged 0 – 23 months across districts in the country. This
involved merging the prevalence data with the spatial data
to generate the map. R software and relevant R packages
such as ggplot2, sf, rvest, dplyr, viridis, ggrepel, and ggthemes
were used to generate the map.
Child wasting was expressed as a dichotomous variable
with category 1 denoting “wasting” and category 0
representing “no wasting.” The analysis employed survey
“SVY” commands of Stata to accommodate the multistage-
stratified sampling design, estimating standard errors and
confidence intervals (CIs) around the prevalence estimates.
The analysis process commenced with bivariate
analysis, exploring the association between the outcome of Figure 1. Child wasting (<-2 SD) during 0-23 months in India (%)
Volume 10 Issue 3 (2024) 62 https://doi.org/10.36922/ijps.453