
Page 70 - IJPS-10-3
P. 70
International Journal of
Population Studies Associated factors of child wasting in India
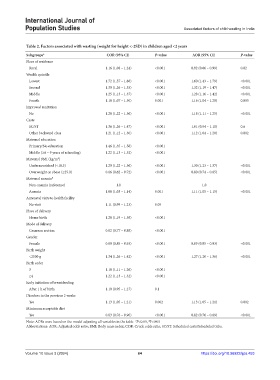
Table 2. Factors associated with wasting (weight for height <‑2SD) in children aged <2 years
Subgroups* COR (95% CI) P‑value AOR (95% CI) P‑value
Place of residence
Rural 1.16 (1.08 – 1.24) <0.001 0.92 (0.86 – 0.99) 0.02
Wealth quintile
Lowest 1.72 (1.57 – 1.88) <0.001 1.60 (1.43 – 1.79) <0.001
Second 1.39 (1.26 – 1.53) <0.001 1.32 (1.19 – 1.47) <0.001
Middle 1.25 (1.13 – 1.37) <0.001 1.28 (1.16 – 1.42) <0.001
Fourth 1.18 (1.07 – 1.30) 0.001 1.16 (1.04 – 1.28) 0.005
Improved sanitation
No 1.28 (1.22 – 1.36) <0.001 1.18 (1.11 – 1.25) <0.001
Caste
SC/ST 1.36 (1.26 – 1.47) <0.001 1.01 (0.94 – 1.10) 0.6
Other backward class 1.21 (1.12 – 1.30) <0.001 1.12 (1.04 – 1.20) 0.002
Maternal education
Primary/No education 1.46 (1.35 – 1.58) <0.001
Middle (≥6 – 9 years of schooling) 1.22 (1.13 – 1.32) <0.001
Maternal BMI (kg/m )
2
Undernourished (<18.5) 1.29 (1.22 – 1.36) <0.001 1.30 (1.23 – 1.37) <0.001
Overweight or obese (≥25.0) 0.66 (0.62 – 0.72) <0.001 0.80 (0.74 – 0.85) <0.001
Maternal anemia $
Non-anemia (reference) 1.0 1.0
Anemia 1.08 (1.03 – 1.14) 0.001 1.11 (1.05 – 1.15) <0.001
Antenatal visits to health facility
No visit 1.11 (0.99 – 1.23) 0.05
Place of delivery
Home birth 1.28 (1.19 – 1.38) <0.001
Mode of delivery
Cesarean section 0.82 (0.77 – 0.88) <0.001
Gender
Female 0.89 (0.85 – 0.93) <0.001 0.89 (0.85 – 0.93) <0.001
Birth weight
<2500 g 1.34 (1.26 – 1.42) <0.001 1.27 (1.20 – 1.36) <0.001
Birth order
3 1.18 (1.11 – 1.26) <0.001
≥4 1.22 (1.13 – 1.32) <0.001
Early initiation of breastfeeding
After 1 h of birth 1.10 (0.95 – 1.27) 0.1
Diarrhea in the previous 2 weeks
Yes 1.13 (1.05 – 1.21) 0.002 1.13 (1.05 – 1.21) 0.002
Minimum acceptable diet
Yes 0.83 (0.76 – 0.90) <0.001 0.82 (0.76 – 0.89) <0.001
Note: AORs were based on the model adjusting all variables in the table. *P<0.05, P<0.05
$
Abbreviations: AOR: Adjusted odds ratio; BMI: Body mass index; COR: Crude odds ratio; SC/ST: Scheduled caste/Scheduled tribe.
Volume 10 Issue 3 (2024) 64 https://doi.org/10.36922/ijps.453