
Page 69 - IJPS-10-3
P. 69
International Journal of
Population Studies Associated factors of child wasting in India
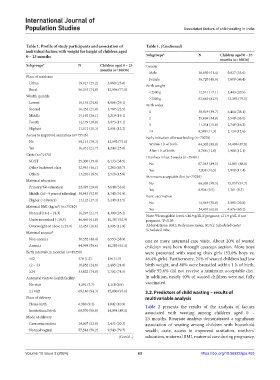
Table 1. Profile of study participants and association of Table 1. (Continued)
individual factors with weight for height of children aged
0 – 23 months Subgroups* N Children aged 0 – 23
months (n=16836)
Subgroups* N Children aged 0 – 23 Gender
months (n=16836)
Male 38,830 (51.4) 9,027 (53.6)
Place of residence
Female 36,720 (48.6) 7,809 (46.4)
Urban 19,017 (25.2) 3,880 (23.0)
Birth weight
Rural 56,533 (74.8) 12,956 (77.0)
<2500 g 12,911 (17.1) 3,443 (20.5)
Wealth quintile
≥2500 g 62,640 (82.9) 13,393 (79.5)
Lowest 18,154 (24.0) 4,906 (29.1)
Birth order
Second 16,454 (21.8) 3,787 (22.5)
1 30,019 (39.7) 6,414 (38.1)
Middle 15,192 (20.1) 3,219 (19.1)
2 25,669 (34.0) 5,549 (33.0)
Fourth 14,179 (18.8) 2,873 (17.1)
3 11,354 (15.0) 2,749 (16.3)
Highest 11,571 (15.3) 2,051 (12.2)
≥4 8,508 (11.3) 2,124 (12.6)
Access to improved sanitation (n=75546) Early initiation of breastfeeding (n=73070)
No 59,115 (78.3) 12,592 (75.0)
Within 1 h of birth 64,302 (88.0) 14,406 (87.9)
Yes 16,431 (21.7) 4,244 (25.0)
After 1 h of birth 8,768 (12.0) 1,988 (12.1)
Caste (n=71471)
Diarrhea in last 2 weeks (n=75481)
SC/ST 25,300 (35.4) 6,133 (38.5)
No 67,543 (89.5) 14,901 (88.6)
Other backward class 32,945 (46.1) 7,283 (45.7)
Yes 7,938 (10.5) 1,918 (11.4)
Others 13,226 (18.5) 2,520 (15.8)
Minimum acceptable diet (n=73239)
Maternal education
No 66,305 (90.5) 15,057 (91.7)
Primary/No education 22,495 (29.8) 5,648 (33.6)
Yes 6,934 (9.5) 1,361 (8.3)
Middle (≥6 – 9 years of schooling) 39,943 (52.9) 8,740 (51.9)
Basic vaccination
Higher (>10years) 13,112 (17.4) 2,449 (14.5)
No 14,949 (38.0) 3,095 (39.8)
Maternal BMI (kg/m ) (n=75210) Yes 24,435 (62.0) 4,676 (60.2)
2
Normal (18.4 – 24.9) 16,297 (21.7) 4,399 (26.2)
Note: Hemoglobin levels ≤10.9 g/dL if pregnant; ≤11.9 g/dL if not
$
Undernourished (<18.5) 46,460 (61.8) 10,367 (61.9) pregnant. *P<0.05
Overweight or obese (≥25.0) 12,453 (16.6) 1,995 (11.9) Abbreviations: BMI: Body mass index; SC/ST: Scheduled caste/
Scheduled tribe.
Maternal anemia $
Non-anemia 30,552 (40.4) 6,553 (38.9) one or more antenatal care visits. About 20% of wasted
Anemia 44,998 (59.6) 10,283 (61.1) children were born through cesarean section. More boys
Birth interval (in months) (n=45250) were presented with wasting than girls (53.6% boys vs.
<12 576 (1.2) 156 (1.5) 46.4% girls). Furthermore, 21% of wasted children had low
12 – 23 10,852 (24.0) 2,485 (24.0) birth weight, and 88% were breastfed within 1 h of birth,
≥24 33,822 (74.8) 7,702 (74.5) while 92.6% did not receive a minimum acceptable diet.
Antenatal visits to health facility In addition, nearly 40% of wasted children were not fully
No visit 4,091 (5.7) 1,118 (6.9) vaccinated.
≥1 visit 68,140 (94.3) 15,090 (93.1) 3.2. Predictors of child wasting – results of
Place of delivery multivariable analysis
Home birth 6,980 (9.2) 1,842 (10.9) Table 2 presents the results of the analysis of factors
Institutional birth 68,570 (90.8) 14,994 (89.1) associated with wasting among children aged 0 –
Mode of delivery 23 months. Bivariate analysis demonstrated a significant
Caesarean section 18,007 (23.8) 2,432 (20.3) association of wasting among children with household
Normal vaginal 57,544 (76.2) 9,543 (79.7) wealth, caste, access to improved sanitation, mothers’
(Cont’d...) education, maternal BMI, maternal care during pregnancy,
Volume 10 Issue 3 (2024) 63 https://doi.org/10.36922/ijps.453