
Page 78 - IJPS-10-3
P. 78
International Journal of
Population Studies COVID-19 and fertility in Costa Rica
recording an annual reduction of 7%. A layman observer also in 2021: a 10% drop compared to 7% among native
may regard this birth reduction as an outcome of the Costa Ricans. Unfortunately, there is no reliable data on
pandemic. However, a more nuanced approach notes that the number of migrants in Costa Rica (denominators) to
even larger drops had occurred during the previous year compute fertility rates for this population.
(9%) and in the year before (8%); therefore, the 7% TFR
drop in 2020 seems to be a continuation of the declining 3.2. Drops in the fertility of native-born women by
trend in fertility rather than an outcome of the pandemic month
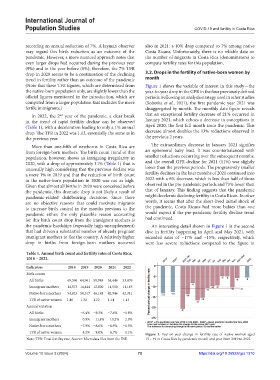
(Note that these TFR figures, which are determined from Figure 1 shows the variable of interest in this study—the
the native-born population only, are slightly lower than the year-to-year drop in the GFR in the four previously defined
official figures mentioned in the introduction, which are periods. Following an analysis strategy used in other studies
computed from a larger population that includes the more (Sobotka et al., 2021), the first pandemic year 2021 was
fertile immigrants.) disaggregated by month. The monthly data figure reveals
In 2022, the 2 year of the pandemic, a clear break that an exceptional fertility decrease of 21% occurred in
nd
in the trend of rapid fertility decline can be observed January 2021, which echoes a decrease in conceptions in
(Table 1), with a deceleration leading to only a 1% annual April 2020, the first full month since the pandemic. This
drop. The TFR in 2022 was 1.13, essentially the same as in decrease almost doubles the 13% reductions observed in
the previous year. the previous 2 years.
More than one-fifth of newborns in Costa Rica are The extraordinary decrease in January 2021 signifies
from foreign-born mothers. The birth count trend of this an ephemeral baby bust. It was counterbalanced with
population, however, shows an intriguing irregularity in smaller reductions occurring over the subsequent months,
2020, with a drop of approximately 11% (Table 1) that is and the overall GFR decline for 2021 (11%) was slightly
unusually high considering that the previous decline was lower than the previous periods. The progressively smaller
a mere 1% in 2019 and that the reduction of birth count fertility declines in the later months of 2021 continued into
in the native-born population in 2020 was not as high. 2022 with a 6% decrease, which is less than half of those
Given that almost all births in 2020 were conceived before observed in the pre-pandemic periods and 71% lower than
the pandemic, this dramatic drop is not likely a result of that of January. This finding suggests that the pandemic
pandemic-related childbearing decisions. Since there might decelerate declining fertility in Costa Rican. In other
are no objective reasons that could motivate migrants words, it seems that after the short-lived initial shock of
to increase birth control in the months previous to the the pandemic, Costa Ricans had more babies than one
pandemic either, the only plausible reason accounting would expect if the pre-pandemic fertility decline trend
for this birth count drop from the immigrant mothers is had continued.
the pandemic hardships (especially high unemployment) An interesting detail shown in Figure 1 is the second
that had driven a substantial number of already pregnant dive in fertility happening in April and May 2021, with
immigrant mothers to flee the country. A relatively higher recorded rates of −17% and −15%, respectively, which
drop in births from foreign-born mothers occurred were less severe reductions compared to the figure in
Table 1. Annual birth count and fertility rates of Costa Rica,
2018 – 2022.
Indicators 2018 2019 2020 2021 2022
Birth counts
All births 69,396 64,961 58,948 54,446 53,476
Immigrant mothers 14,573 14,444 12,800 11,500 11,165
Native-born mothers 54,823 50,517 46,148 42,946 42,311
TFR of native women 1.46 1.34 1.22 1.14 1.13
Annual variation
All births −6.4% −9.3% −7.6% −1.8%
Immigrant mothers −0.9% −11.4% −10.2% −2.9%
Native-born mothers −7.9% −8.6% −6.9% −1.5%
TFR of native women −8.2% −9.0% −6.7% −1.1% Figure 1. Year-on-year change in fertility rate of native women aged
Note: TFR: Total fertility rate. Source: Microdata files from the TSE. 15 – 49 in Costa Rica by pandemic month and year from 2019 to 2022
Volume 10 Issue 3 (2024) 72 https://doi.org/10.36922/ijps.1310