
Page 79 - IJPS-10-3
P. 79
International Journal of
Population Studies COVID-19 and fertility in Costa Rica
January. These declines mirror falls in conceptions in Notwithstanding the above, the plunge associated with
July and August 2020, when a new array of containment the shock of the first pandemic month is less clear, if any, in
measures were rolled out, including mandatory use of the younger group. Its GFR fell 18% in January 2021, which
masks in public places and more stringent road restrictions is not that different than the 16% of the previous period or
(Rosero-Bixby & Jiménez-Fontana 2021). These 2 months the 19% and 20% of April and May 2021, respectively.
saw exponential growth in the number of cases and
deaths, forcing authorities to adopt measures to “flatten 3.4. Fertility decline by birth order
the epidemic curve,” but were far from being the worst in Figure 3 shows the changes in conditional fertility rates by
terms of COVID-19 incidence and mortality. women’s parity, considering first, second, and third births.
For simplicity, monthly bars were grouped into quarter
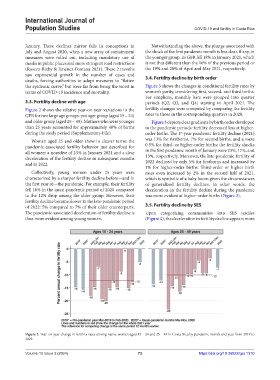
3.3. Fertility decline with age periods (Q2, Q3, and Q4) starting in April 2021. The
Figure 2 shows the relative year-on-year variations in the fertility changes were computed by comparing the fertility
GFR for two large age groups: younger group (aged 15 – 24) rates to those in the corresponding quarters in 2020.
and older group (aged 25 – 49). Mothers who were younger Figure 3 depicts clear gradients by birth order developed
than 25 years accounted for approximately 40% of births in the pandemic periods: fertility decreased less at higher-
during the study period (Supplementary File). order births. The 1 -year pandemic fertility decline (2021)
st
Women aged 25 and older show in clearer terms the was 13% for firstborns, 7% for second births, and a mere
pandemic-associated fertility behavior just described for 0.5% for third- or higher-order births; the fertility shocks
all women: a nosedive of 23% in January 2021 and a clear in the first pandemic month of January were 23%, 17%, and
deceleration of the fertility decline in subsequent months 13%, respectively. Moreover, the late-pandemic fertility of
and in 2022. 2022 declined by only 5% for firstborns and increased by
1% for higher-order births. Third-order or higher birth
Collectively, young women under 25 years were rates even increased by 2% in the second half of 2021,
characterized by a sharper fertility decline before—and in which is symbolic of a baby boom given the circumstances
the first year of—the pandemic. For example, their fertility of generalized fertility declines. In other words, the
fell 16% in the quasi-pandemic period of 2020 compared deceleration in the fertility decline during the pandemic
to the 12% drop among the older group. However, their was more evident at higher-order births (Figure 3).
fertility decline became slower in the late-pandemic period
of 2022: 5% compared to 7% of their older counterparts. 3.5. Fertility decline by SES
The pandemic-associated deceleration of fertility decline is Upon categorizing communities into SES terciles
thus more evident among young women. (Figure 4), the deceleration in fertility decline appears more
Figure 2. Year-on-year change in fertility rates among native women aged 15 – 24 and 25 – 49 in Costa Rica by pandemic month and year from 2019 to
2022
Volume 10 Issue 3 (2024) 73 https://doi.org/10.36922/ijps.1310