
Page 136 - IJPS-10-4
P. 136
International Journal of
Population Studies Household on teens’ COVID-19 prevention
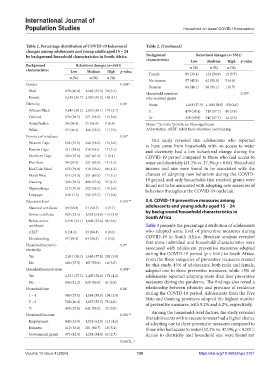
Table 2. Percentage distribution of COVID‑19 behavioral Table 2. (Continued)
changes among adolescents and young adults aged 15 – 24
by background/household characteristics in South Africa Background Behavioral changes (n=5581)
characteristics Low Medium High p‑value
Background Behavioral changes (n=5581) n (%) n (%) n (%)
characteristics Low Medium High p‑value
n (%) n (%) n (%) Family 89 (39.4) 124 (54.9) 13 (5.7)
No income 57 (45.9) 62 (50.0) 5 (4.0)
Gender 0.004*
Pension 64 (48.1) 68 (51.1) 1 (0.7)
Male 878 (40.8) 1,282 (55.9) 70 (3.3)
Household members 0.35 ns
Female 1,259 (36.7) 2,030 (59.2) 142 4.1) who received grants
Ethnicity 0.09 None 1,419 (37.9) 1,168 (58.0) 150 (4.0)
African/Black 1,845 (38.2) 2,810 (58.1) 179 (3.7) 1 479 (38.4) 719 (57.7) 48 (3.8)
Colored 179 (38.7) 271 (58.3) 13 (2.8) 2+ 239 (39.9) 345 (57.7) 14 (2.3)
Asian/Indian 16 (36.4) 25 (56.8) 3 (6.8) Notes: **p<0.01; *p<0.05; ns: Non-significant.
White 97 (40.4) 126 (52.5) 17 (7.0) Abbreviation: ABET: Adult basic education and training.
Province of residence 0.05*
Our study revealed that adolescents who reported
Western Cape 154 (37.5) 242 (58.9) 15 (3.6) to have come from households with no access to water
Eastern Cape 211 (38.6) 318 (58.2 17 (3.1) and electricity had a low behavioral change during the
Northern Cape 120 (35.9) 207 (61.9) 7 (2.1) COVID-19 period compared to those who had access to
Free State 99 (29.5) 221 (65.9) 15 (4.5) water and electricity (41.2% vs. 37.3%; p < 0.04). Household
KwaZulu-Natal 652 (39.8) 918 (56.0) 68 (4.2) income and size were found to be associated with the
North West 114 (34.3) 201 (60.5) 17 (5.1) chances of adopting new behaviors during the COVID-
Gauteng 326 (38.2) 490 (57.4) 37 (4.3) 19 period, and only households that received grants were
found not to be associated with adopting new measures of
Mpumalanga 213 (39.9) 302 (56.5) 19 (3.6) behaviors throughout the COVID-19 outbreak.
Limpopo 248 41.5) 333 (55.7) 17 (2.8)
Education level 0.001** 3.4. COVID-19 preventive measures among
National certificate 19 (35.8) 31 (58.5) 3 (5.7) adolescents and young adults aged 15 – 24
Senior certificate 825 (33.5) 1,521 (61.8) 116 (3.0) by background/household characteristics in
South Africa
Below senior 1,190 (43.1) 1,603 (55.6) 88 (3.0)
certificate Table 3 presents the percentage distribution of adolescents
ABET 6 (31.6) 13 (68.4) 0 (0.0) who adopted some level of preventive measures during
No schooling 97 (59.4) 64 (38.5) 5 (3.0) COVID-19 in South Africa. Bivariate analysis revealed
Household access to 0.9 ns that some individual and household characteristics were
associated with adolescent preventive measures adopted
electricity
Yes 2,031 (38.3) 3,065 (57.8) 202 (3.8) during the COVID-19 period (p < 0.01) in South Africa.
From the three categories of preventive measures created
No 106 (37.5) 167 (59.0) 10 (3.5) for this study, 45% of adolescents, both male and female,
Household access to water 0.004* adopted one to three preventive measures, while <5% of
Yes 1,531 (37.3) 2,407 (58.6) 171 (4.2) adolescents reported adopting more than four preventive
No 606 (41.2) 825 (56.0) 41 (2.8) measures during the pandemic. The findings also reveal a
Household size 0.08 relationship between ethnicity and province of residence
1 – 4 980 (37.0) 1,564 (59.0) 104 (3.9) during the COVID-19 period. Adolescents from the Free
State and Gauteng provinces adopted the highest number
5 – 6 748 (40.4) 1,027 (55.5) 75 (4.0) of preventive measures, with 9.2% and 6.2%, respectively.
7+ 409 (37.8) 641 (59.2) 33 (3.0)
Among the household-level factors, the study revealed
Household income 0.001** that adolescents with no access to water had a higher chance
Employment 840 (33.9) 1,521 (61.5) 113 (4.6) of adopting one to three preventive measures compared to
Business 112 (33.8) 201 (60.7) 18 (5.4) those who had access to water (52.2% vs. 47.9%; p < 0.001).
Government grants 973 (42.5) 1,255 (54.8) 62 (2.7) Access to electricity and household size were found not
(Cont’d...)
Volume 10 Issue 4 (2024) 130 https://doi.org/10.36922/ijps.2751