
Page 137 - IJPS-10-4
P. 137
International Journal of
Population Studies Household on teens’ COVID-19 prevention
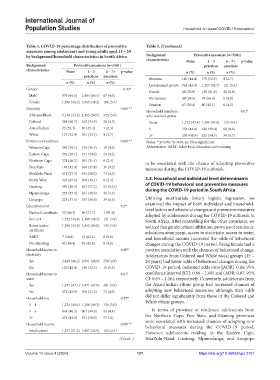
Table 3. COVID‑19 percentage distribution of preventive Table 3. (Continued)
measures among adolescents and young adults aged 15 – 24
by background/household characteristics in South Africa Background Preventive measures (n=5581)
characteristics None 1 – 3 4 – 7+ p‑value
Background Preventive measures (n=5581) practices practices
characteristics None 1 – 3 4 – 7+ p‑value n (%) n (%) n (%)
practices practices Business 147 (44.4) 175 (52.9) 9 (2.7)
n (%) n (%) n (%)
Government grants 962 (42.0) 1,207 (52.7) 121 (5.3)
Gender 0.03*
Family 68 (30.0) 138 (61.0) 20 (8.8)
Male 979 (45.5) 1,084 (50.4) 87 (4.0)
No income 49 (39.5) 70 (56.4) 5 (4.0)
Female 1,590 (46.3) 1,655 (48.2) 186 (5.4)
Pension 67 (50.4) 60 (45.1) 6 (4.5)
Ethnicity 0.001**
Household members 0.01*
Africans/Black 2,138 (44.2) 2,453 (50.7) 243 (5.0) who received grants
Colored 281 (60.7) 162 (34.9) 20 (4.3) None 1,772 (47.4) 1,786 (47.8) 179 (4.8)
Asian/Indian 23 (52.3) 20 (45.4) 1 (2.3) 1 558 (44.8) 628 950.4) 60 (4.8)
White 127 (52.9) 104 (43.3) 9 (3.7) 2+ 239 939.9) 325 (54.3) 34 (5.7)
Province of residence 0.001** Notes: **p<0.01; *p<0.05; ns: Non-significant.
Western Cape 243 (59.1) 150 (36.5) 18 (4.4) Abbreviation: ABET: Adult basic education and training.
Eastern Cape 252 (36.1) 271 (49.6) 23 (4.2)
Northern Cape 221 (66.2) 105 (31.4) 8 (2.4) to be associated with the chance of adopting preventive
Free State 144 (42.9) 160 (47.8) 31 (9.2) measures during the COVID-19 outbreak.
KwaZulu-Natal 611 (37.3) 954 (58.2) 73 (4.5)
North West 224 (67.5) 100 (30.1) 8 (2.4) 3.5. Household and individual level determinants
Gauteng 397 (46.5) 403 (47.2) 53 (6.21) of COVID-19 behavioral and preventive measures
during the COVID-19 period in South Africa
Mpumalanga 253 (47.4) 261 (48.9) 20 (3.7)
Limpopo 224 (37.5) 335 (56.0) 39 (6.5) Utilizing multivariate binary logistic regression, we
Education level 0.3 ns examined the impact of both individual and household-
National certificate 32 (60.4) 20 (37.7) 1 (91.9) level factors on behavioral changes and preventive measures
adopted by adolescents during the COVID-19 outbreak in
Snr cert 1,152 (46.8) 1,189 (48.3) 121 (4.9) South Africa. After controlling for the other covariates, we
Below senior 1,296 (44.9) 1,442 (50.0) 143 (4.9) noticed that gender, ethnic affiliation, province of residence,
certificate education attainment, access to electricity, access to water,
ABET 7 (36.8) 12 (63.2) 0 (0.0) and household income increased the odds of behavioral
No schooling 82 (49.4) 76 (45.8) 8 (4.8) changes during the COVID-19 period. Being female had a
Household access to 0.45 ns positive association with the chances of behavioral change.
electricity Adolescents from Colored and White racial groups (15 –
Yes 2,449 (46.2) 2,591 (48.9) 258 (4.9) 24 years) had lower odds of behavioral changes during the
No 120 (42.4) 148 (52.3) 15 (5.3) COVID-19 period; (adjusted odds ratio [AOR]: 0.84; 95%
Household access to 0.01* confidence interval [CI]: 0.66 – 1.08) and (AOR: 0.87; 95%
water CI: 0.65 – 1.16), respectively. Conversely, adolescents from
Yes 1,937 (47.1) 1,971 (47.9) 281 (4.9) the Asian/Indian ethnic group had increased chances of
No 632 (42.9) 768 (52.2) 72 (4.9) adopting new behavioral measures, although their odds
Household size 0.42 ns did not differ significantly from those of the Colored and
White ethnic groups.
1 – 4 1,234 (46.6) 1,280 (48.3) 134 (5.0)
5 – 6 861 (46.5) 907 (49.0) 82 (4.4) In terms of province or residence, adolescents from
7+ 474 (43.8) 552 (50.9) 57 5.3) the Northern Cape, Free State, and Gauteng provinces
Household income 0.001** were associated with increased chances of adopting new
behavioral measures during the COVID-19 period.
Employment 1,275 (51.5) 1,087 (43.9) 112 (4.5)
However, adolescents residing in the Eastern Cape,
(Cont’d...) KwaZulu-Natal, Gauteng, Mpumalanga, and Limpopo
Volume 10 Issue 4 (2024) 131 https://doi.org/10.36922/ijps.2751