Page 139 - IJPS-10-4
P. 139

International Journal of
            Population Studies                                                 Household on teens’ COVID-19 prevention


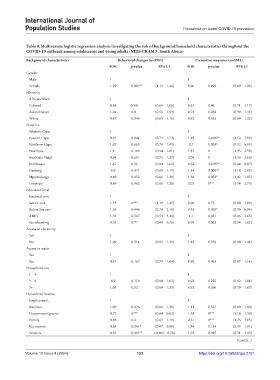
            Table 4. Multivariate logistic regression analysis investigating the risk of background/household characteristics throughout the
            COVID‑19 outbreak among adolescents and young adults (NIDS‑CRAM 5, South Africa)
            Background characteristics             Behavioral changes (n=5581)      Preventive measures (n=5581)
                                               AOR       p‑value    95% CI      AOR      p‑value      95% CI
            Gender
             Male                                 1                                1
             Female                             1.29     0.001**   (1.15 – 1.44)  0.96    0.492     (0.69 – 1.22)
            Ethnicity
             African/Black                        1                                1
             Colored                            0.84     0.191     (0.66 – 1.08)  0.91    0.48      (0.71 – 1.17)
             Asian/Indian                       1.04      0.9      (0.56 – 1.93)  0.72    0.284     (0.39 – 1.31)
             White                              0.87      0.349    (0.65 – 1.16)  0.92    0.553     (0.69 – 1.22)
            Province
             Western Cape                         1                                1
             Eastern Cape                       0.97      0.844    (0.73 – 1.73)  1.49    0.006**   (1.12 – 1.99)
             Northern Cape                      1.07      0.663    (0.79 – 1.43)  0.7     0.024*    (0.52 – 0.95)
             Free State                           1.3     0.109    (0.94 – 1.81)  1.87    0         (1.35 – 2.58)
             KwaZulu-Natal                      0.94      0.651    (0.72 – 1.23)  2.04    0         (1.56 – 2.66)
             Northwest                          1.67      0.36     (0.84 – 1.62)  0.62    0.006**   (0.44 – 0.87)
             Gauteng                            0.9       0.471    (0.69 – 1.19)  1.54    0.002**   (1.18 – 2.02)
             Mpumalanga                         0.89      0.452    (0.66 – 1.20)  1.38    0.034*    (1.02 – 1.85)
             Limpopo                            0.89      0.462    (0.66 – 1.20)  2.07    0***      (1.54 – 2.79)
            Education level
             National cert                        1                                1
             Senior cert                        1.33      0***     (1.19 – 1.49)  0.98    0.73      (0.88 – 1.09)
             Below Snr cert                     1.24      0.446    (0.70 – 2.18)  0.53    0.029*    (0.30 – 0.94)
             ABET                               1.32      0.547    (0.53 – 3.24)  1.1     0.831     (0.46 – 2.65)
             No schooling                       0.55      0***     (0.40 – 0.76)  0.74    0.063     (0.54 – 1.02)
            Access to electricity
             Yes                                  1                                1
             No                                 1.09      0.514    (0.85 – 1.39)  1.13    0.339     (0.88 – 1.44)
            Access to water
             Yes                                  1                                1
             No                                 0.91      0.167    (0.79 – 1.04)  0.99    0.963     (0.87 – 1.14)
            Household size
             1 – 4                                1                                1
             5 – 6                              0.9       0.118    (0.80 – 1.02)  0.93    0.225     (0.82 – 1.04)
             7+                                 1.05      0.52     (0.89 – 1.23)  0.92    0.296     (0.79 – 1.07)
            Household income
             Employment                           1                                1
             Business                           1.09      0.476    (0.86 – 1.38)  1.12    0.327     (0.89 – 1.40)
             Government grants                  0.72      0***     (0.64 – 0.82)  1.33    0***      (1.18 – 1.50)
             Family                             0.83      0.2      (0.63 – 1.10)  2.31    0***      (1.75 – 3.05)
             No income                          0.68      0.041*   (0.47 – 0.98)  1.34    0.114     (0.93 – 1.91)
             Pension                            0.55     0.001**   (0.389 – 0.78)  1.02   0.925     (0.71 – 1.45)
                                                                                                      (Cont’d...)

            Volume 10 Issue 4 (2024)                       133                        https://doi.org/10.36922/ijps.2751
   134   135   136   137   138   139   140   141   142   143   144