
Page 103 - IJPS-11-1
P. 103
International Journal of
Population Studies Malaysian women in logistics: Stay or switch?
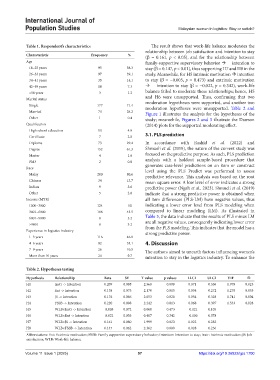
Table 1. Respondent’s characteristics The result shows that work-life balance moderates the
relationship between job satisfaction and intention to stay
Characteristic Frequency % (β = 0.161, p < 0.05), and for the relationship between
Age family-supportive supervisory behavior intention to
18–25 years 95 38.3 stay (β = 0.147, p < 0.01), thus supporting H7 and H8 in the
26–33 years 97 39.1 study. Meanwhile, for H5 intrinsic motivation intention
34–41 years 35 14.1 to stay (β = −0.005, p = 0.473) and extrinsic motivation
42–49 years 18 7.3 intention to stay (β = −0.022, p = 0.342), work-life
>50 years 3 1.2 balance failed to moderate these relationships; hence, H5
Marital status and H6 were unsupported. Thus, confirming that two
moderation hypotheses were supported, and another two
Single 177 71.4 moderation hypotheses were unsupported. Table 2 and
Married 70 28.2 Figure 1 illustrates the analysis for the hypotheses of the
Other 1 0.4 study; meanwhile, Figures 2 and 3 illustrate the Dawson
Qualification (2014) plots for the supported moderating effect.
High school education 10 4.0
Certificate 7 2.8 3.1. PLS prediction
Diploma 73 29.4 In accordance with Rashid et al. (2022) and
Degree 152 61.3 Shmueli et al. (2019), the nature of the current study was
Master 4 1.6 focused on the predictive purpose. As such, PLS prediction
PhD 2 0.8 analysis with a holdout sample-based procedure that
Race generates case-level predictions on an item or construct
level using the PLS Predict was performed to assess
Malay 200 80.6 predictive relevance. This analysis was based on the root
Chinese 34 13.7 mean square error. A low level of error indicates a strong
Indian 9 3.6 predictive power (Ngah et al., 2023). Shmueli et al. (2019)
Other 5 2.0 indicate that a strong predictive power is obtained when
Income (MYR) all item differences (PLS-LM) have negative values, thus
1000–3000 124 50 indicating a lower error level from PLS modeling when
3001–6000 108 43.5 compared to linear modeling (LM). As illustrated in
6001–9000 8 3.2 Table 3, the data indicate that the results of PLS minus LM
>9001 8 3.2 are all negative values, consequently indicating lower error
from the PLS modeling. This indicates that the model has a
Experience in logistics industry strong predictive power.
1–3 years 116 46.8
4–6 years 82 33.1 4. Discussion
7–9 years 26 10.5 The authors aimed to unearth factors influencing women’s
More than 10 years 24 9.7 intention to stay in the logistics industry. To enhance the
Table 2. Hypotheses testing
Hypothesis Relationship Beta SE T value p values LLCI ULCI VIF f2
H1 Instr -> Intention 0.209 0.088 2.368 0.009 0.071 0.356 1.979 0.025
H2 Ext -> Intention 0.158 0.073 2.170 0.015 0.034 0.272 1.279 0.053
H3 JS -> Intention 0.176 0.086 2.053 0.020 0.054 0.328 1.741 0.004
H4 FSSB -> Intention 0.220 0.098 2.242 0.013 0.068 0.397 1.533 0.028
H5 WLB×Instr -> Intention −0.005 0.072 0.068 0.473 −0.121 0.105
H6 WLB×Ext -> Intention −0.022 0.053 0.407 0.342 −0.100 0.078
H7 WLB×JS -> Intention 0.161 0.080 1.999 0.023 0.022 0.282
H8 WLB×FSSB -> Intention 0.147 0.062 2.362 0.009 0.028 0.236
Abbreviations: Ext: Extrinsic motivation; FSSB: Family supportive supervisory behavior; Intention: Intention to stay; Instr: Intrinsic motivation; JS: Job
satisfaction; WLB: Work-life balance.
Volume 11 Issue 1 (2025) 97 https://doi.org/10.36922/ijps.1700