
Page 118 - IJPS-11-2
P. 118
International Journal of
Population Studies Gendered division of household labor in Iran
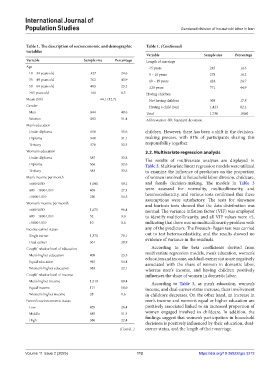
Table 1. The description of socioeconomic and demographic Table 1. (Continued)
variables
Variable Sample size Percentage
Variable Sample size Percentage Length of marriage
Age <5 years 245 14.3
18 – 34 years old 427 24.6 5 – 10 years 278 16.2
35 – 49 years old 762 43.9 10 – 19 years 424 24.7
50 – 64 years old 403 23.2 ≥20 years 771 44.9
≥65 years old 144 8.3 Having children
Mean (SD) 44.1 (12.7) Not having children 308 17.8
Gender Having a child (ren) 1,423 82.2
Men 844 48.6 Total 1,736 100.0
Women 892 51.4 Abbreviation: SD: Standard deviation.
Man’s education
Under diploma 618 35.6 children. However, there has been a shift in the decision-
Diploma 540 31.1 making process, with 81% of participants sharing this
Tertiary 578 33.3 responsibility together.
Woman’s education 3.2. Multivariate regression analysis
Under diploma 587 33.8 The results of multivariate analyses are displayed in
Diploma 566 32.6 Table 3. Multivariate linear regression models were utilized
Tertiary 583 33.6 to examine the influence of predictors on the proportion
Man’s income per month of women involved in household labor division, childcare,
<600 USD 1,000 58.2 and family decision-making. The models in Table 3
600 – 1000 USD 469 27.3 were assessed for normality, multicollinearity, and
>1000 USD 250 14.5 heteroscedasticity, and various tests confirmed that these
assumptions were satisfactory. The tests for skewness
Woman’s income per month and kurtosis tests showed that the data distribution was
<600 USD 1,671 96.4 normal. The variance inflation factor (VIF) was employed
600 – 1000 USD 52 3.0 to identify multicollinearity, and all VIF values were <5,
>1000 USD 10 0.6 indicating that there was no multicollinearity problem with
Income earner status any of the predictors. The Breusch–Pagan test was carried
Single earner 1,370 79.1 out to test heteroscedasticity, and the results showed no
Dual earner 361 20.9 evidence of variance in the residuals.
Couple’ relative level of education According to the beta coefficients derived from
Men’s higher education 408 23.5 multivariate regression models, men’s education, women’s
education and income, and dual-earner status are negatively
Equal education 945 54.4 associated with the share of women in domestic labor,
Women’s higher education 383 22.1 whereas men’s income, and having children positively
Couple’ relative level of income influences the share of women in domestic labor.
Men’s higher income 1,519 88.4 According to Table 3, as men’s education, women’s
Equal income 171 10.0 income, and dual-earner status increase, their involvement
Women’s higher income 28 1.6 in childcare decreases. On the other hand, an increase in
Parent’s socioeconomic status men’s income and women’s equal or higher education are
Low 455 26.4 positively associated linked to an increased proportion of
Middle 885 51.3 women engaged involved in childcare. In addition, the
High 386 22.4 findings suggest that women’s participation in household
decisions is positively influenced by their education, dual-
(Cont’d...) earner status, and the length of their marriage.
Volume 11 Issue 2 (2025) 112 https://doi.org/10.36922/ijps.3212