
Page 22 - IJPS-11-3
P. 22
International Journal of
Population Studies Nuptiality patterns among Ethiopian women
the specific descriptions of the variables and their the cohorts aged 15 – 25 (Figure 1). Therefore, the shift
measurements utilized for this study are shown in Table 1. in the magnitude and timing of marriage between the two
The variables in this study are widely acknowledged in the cohorts was evaluated at ages 15, 20, and 25.
relevant literature as key determinants influencing the Using Oaxaca decomposition, the degree and timing of
complex relationship between individual characteristics, marriage were broken down into components that could
community variables, and the timing of the first be attributed to variations in individual attributes and
marriage. The selection of these specific variables was behavioral responses using multivariate decomposition
guided by and grounded by the existing body of research analysis. In this context, changes in behavioral response
on this topic (Dejene & Gurmu, 2022; Hertrich, 2017;
Imron et al., 2020). refer to how individuals adjust their behaviors as a result
of changing characteristics, whereas changes in the
2.3. Data processing and analysis population’s social, economic, and demographic qualities
are referred to as changing characteristics (Rahimi &
STATA 16.0 was used for data management and analysis. Hashemi Nazari, 2021).
Initially, the CIF for age at first marriage was computed
using survival analysis. Before decomposing the change For the Oaxaca decomposition, assuming the second
in age at first marriage, the difference in CIF between cohort as the reference group, the model specification for
the two birth cohorts was tested (Sayers et al., 2018). the decomposition analysis and interpretation is as follows
Statistically significant differences were observed between (Rahimi & Hashemi Nazari, 2021):
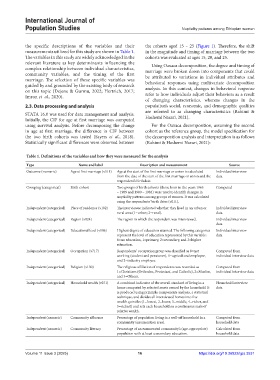
Table 1. Definitions of the variables and how they were measured for the analysis
Type Name and label Description and measurement Source
Outcome (numeric) Age at first marriage (v511) Age at the start of the first marriage or union is calculated Individual interview
from the date of the start of the first marriage or union and the data
respondent’s birthdate.
Grouping (categorical) Birth cohort Two groups of birth cohorts (those born in the years 1965 Computed
– 1969 and 1980 – 1984) were used to identify changes in
nuptiality patterns among groups of women. It was calculated
using the respondents’ birth dates (v011).
Independent (categorical) Place of residence (v102) The interviewee indicated whether they lived in an urban or Individual interview
rural area (1=urban; 2=rural). data
Independent (categorical) Region (v024) The region in which the respondent was interviewed. Individual interview
data
Independent (categorical) Educational level (v106) Highest degree of education attained. The following categories Individual interview
represent the level of education represented by this variable: data
0=no education, 1=primary, 2=secondary, and 3=higher
education.
Independent (categorical) Occupation (v717) Respondents’ occupation group was classified as 0=not Computed from
working (student and pensioner), 1=agricultural employee, individual interview data
and 2=industry employee.
Independent (categorical) Religion (v130) The religious affiliation of respondents was recorded as Computed from
1=Christians (Orthodox, Protestant, and Catholic), 2=Muslim, individual interview data
and 3=Others.
Independent (categorical) Household wealth (v271) A combined indicator of the overall standard of living in a Household interview
home computed by selected assets owned by the household. It data
is produced using principle components analysis, a statistical
technique, and divides all interviewed homes into five
wealth quintiles (1=lowest, 2=lower, 3=middle, 4=richer, and
5=richest) and sets each household on a continuous scale of
relative wealth.
Independent (numeric) Community affluence Percentage of population living in a well-off household in a Computed from
community (enumeration area). household data
Independent (numeric) Community literacy Percentage of an enumerated community’s (age-appropriate) Calculated from
population with at least a secondary education. household data
Volume 11 Issue 3 (2025) 16 https://doi.org/10.36922/ijps.3531