
Page 23 - IJPS-11-3
P. 23
International Journal of
Population Studies Nuptiality patterns among Ethiopian women
2.4. Ethical considerations
This study was based on secondary data from the EDHS.
The methodologies and questionnaires used in the EDHSs
were reviewed and approved by the ICF/ORC Institutional
Review Board. In addition, the study methodologies
received ethical approval (no. 3.10/114/2016) from the
Institutional Review Board offices of the Ethiopian Ministry
of Science and Technology and the Ethiopian Health and
Nutrition Research Institute. Verbal consent was obtained
from the respondents before conducting the interviews. To
ensure respondent anonymity, names, and other personal
identifiers were removed from the final dataset.
3. Results
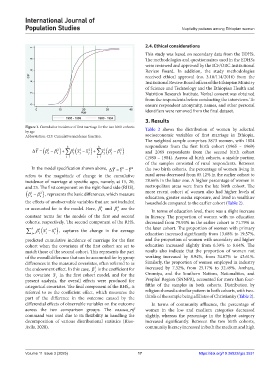
Figure 1. Cumulative incidence of first marriage for the two birth cohorts Table 2 shows the distribution of women by selected
by age
Abbreviation: CIF: Cumulative incidence function. socioeconomic variables of first marriage in Ethiopia.
The weighted sample comprises 3873 women, with 1804
k k respondents from the first birth cohort (1965 – 1969)
1
2
x
Y 1 o o j x x 1 j j and 2069 respondents from the second birth cohort
2
1
2
1
j
j
j
j1 j1 (1980 – 1984). Across all birth cohorts, a sizable portion
of the samples consisted of rural respondents. Between
In the model specification shown above, ∆=Y Y 1 −Y 2 the two birth cohorts, the percentage of women living in
refers to the magnitude of change in the cumulative rural areas decreased from 85.12% in the earlier cohort to
incidence of marriage at specific ages, namely, at 15, 20, 78.66% in the later one. A higher percentage of women in
and 25. The first component on the right-hand side (RHS), metropolitan areas were from the late birth cohort. The
o
2
1
, represents the basic differences, which measure more recent cohort of women also had higher levels of
o
education, greater media exposure, and lived in wealthier
the effects of unobservable variables that are not included households compared to the earlier cohort (Table 2).
2
1
or accounted for in the model. Here, β and β are the In terms of education level, there was a slight increase
o
o
constant terms for the models of the first and second in literacy. The proportion of women with no education
cohorts, respectively. The second component of the RHS, decreased from 79.93% in the earlier cohort to 71.79% in
j
k j 1 x , captures the change in the average the later cohort. The proportion of women with primary
x
2
1
1
j
j
education increased significantly from 13.68% to 19.57%,
predicted cumulative incidence of marriage for the first and the proportion of women with secondary and higher
cohort when the covariates of the first cohort are set to education increased slightly from 6.39% to 8.64%. The
match those of the second cohort. This represents the part results also indicate that the proportion of women not
of the overall difference that can be accounted for by group working increased by 8.94%, from 34.67% to 43.61%.
differences in the measured covariates, often referred to as Similarly, the proportion of women employed in industry
the endowment effect. In this case, β is the coefficient for increased by 7.32%, from 25.17% to 32.49%. Amhara,
1
j
the covariate x in the first cohort model, and for the Oromiya, and the Southern Nations, Nationalities, and
j
present analysis, the overall effects were produced for Peoples’ Region (SNNPR), accounted for more than four-
categorical covariates. The final component of the RHS,, is fifths of the samples in both cohorts. Distribution by
referred to as the coefficient effect, which measures the religion showed a similar pattern in both cohorts, with two-
part of the difference in the outcome caused by the thirds of the sample being affiliates of Christianity (Table 2).
differential effects of observable variables on the outcome In terms of community affluence, the percentage of
across the two comparison groups. The oaxaca_rif women in the low and medium categories decreased
command was used due to its flexibility in handling the slightly, whereas the percentage in the highest category
decomposition of various distributional statistics (Rios- increased significantly. Between the two birth cohorts,
Avila, 2020). community literacy increased in both the medium and high
Volume 11 Issue 3 (2025) 17 https://doi.org/10.36922/ijps.3531