
Page 25 - IJPS-11-3
P. 25
International Journal of
Population Studies Nuptiality patterns among Ethiopian women
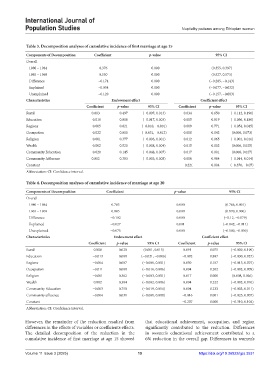
Table 3. Decomposition analyses of cumulative incidence of first marriage at age 15
Components of Decomposition Coefficient p-value 95% CI
Overall
1980 – 1984 0.376 0.000 (0.355, 0.397)
1965 – 1969 0.550 0.000 (0.527, 0.573)
Difference −0.174 0.000 (−0.205, −0.143)
Explained −0.054 0.000 (−0.077, −0.032)
Unexplained −0.120 0.000 (−0.157, −0.083)
Characteristics Endowment effect Coefficient effect
Coefficient p-value 95% CI Coefficient p-value 95% CI
Rural 0.003 0.497 (−0.007, 0.013) 0.034 0.650 (−0.112, 0.190)
Education −0.010 0.006 (−0.017, 0.003) 0.005 0.819 (−0.036, 0.180)
Regions −0.005 0.021 (−0.010, −0.001) 0.009 0.771 (−0.054, 0.045)
Occupation −0.022 0.000 (−0.031, −0.012) 0.008 0.042 (0.000, 0.073)
Religion −0.001 0.377 (−0.003, 0.001) 0.012 0.065 (−0.001, 0.016)
Wealth −0.002 0.520 (−0.008, 0.004) 0.015 0.002 (0.006, 0.025)
Community Education −0.020 0.145 (−0.048, 0.007) 0.017 0.001 (0.008, 0.027)
Community Affluence 0.002 0.383 (−0.003, 0.008) 0.000 0.964 (−0.014, 0.014)
Constant −0.221 0.004 (−0.370, −0.07)
Abbreviation: CI: Confidence interval.
Table 4. Decomposition analyses of cumulative incidence of marriage at age 20
Components of Decomposition Coefficient p-value 95% CI
Overall
1980 – 1984 0.783 0.000 (0.766, 0.801)
1965 – 1969 0.885 0.000 (0.870, 0.900)
Difference −0.102 0.000 (−0.12, −0.079)
Explained −0.027 0.001 (−0.042, −0.011)
Unexplained −0.075 0.000 (−0.100, −0.050)
Characteristics Endowment effect Coefficient effect
Coefficient p-value 95% CI Coefficient p-value 95% CI
Rural 0.008 0.020 (0.001, 0.015) 0.091 0.075 (−0.009, 0.190)
Education −0.013 0.000 (−0.021, −0.006) −0.002 0.897 (−0.030, 0.027)
Regions −0.004 0.007 (−0.008, 0.001) 0.030 0.187 (−0.015, 0.075)
Occupation −0.011 0.000 (−0.016, 0.006) 0.004 0.202 (−0.002, 0.009)
Religion −0.001 0.362 (−0.003, 0.001) 0.017 0.000 (0.008, 0.026)
Wealth 0.002 0.304 (−0.002, 0.006) 0.004 0.222 (−0.002, 0.010)
Community Education −0.003 0.750 (−0.019, 0.014) 0.004 0.233 (−0.003, 0.011)
Community affluence −0.004 0.031 (−0.008, 0.000) −0.016 0.001 (−0.025, 0.007)
Constant −0.207 0.000 (−0.310, 0.104)
Abbreviation: CI: Confidence interval.
However, the remainder of the reduction resulted from that educational achievement, occupation, and region
differences in the effects of variables or coefficients effects. significantly contributed to the reduction. Differences
The detailed decomposition of the reduction in the in women’s educational achievement contributed to a
cumulative incidence of first marriage at age 15 showed 6% reduction in the overall gap. Differences in women’s
Volume 11 Issue 3 (2025) 19 https://doi.org/10.36922/ijps.3531