Page 36 - IJPS-11-4
P. 36

International Journal of
            Population Studies                                                              Stress in early adulthood


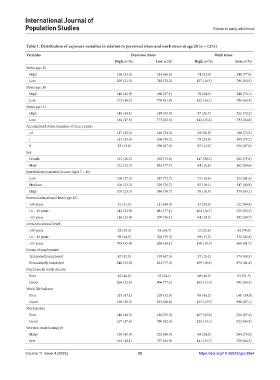
            Table 1. Distribution of exposure variables in relation to perceived stress and work stress at age 28 (n = 1275)
            Variables                                    Perceived stress                   Work stress
                                                  High, n (%)      Low, n (%)       High, n (%)      Low, n (%)
            Stress age: 15
             High                                  108 (33.5)       214 (66.5)       74 (23.0)        248 (77.0)
             Low                                   205 (21.5)       748 (78.5)       157 (16.5)       796 (83.5)
            Stress age: 18
             High                                  140 (42.9)       186 (57.1)       78 (24.0)        248 (76.1)
             Low                                   173 (18.2)       776 (81.8)       153 (16.1)       796 (83.9)
            Stress age: 21
             High                                  149 (44.1)       189 (55.9)       87 (25.7)        251 (74.3)
             Low                                   164 (17.5)       773 (82.5)       144 (15.4)       793 (84.6)
            Accumulated stress (number of time points)
             ≥2                                    117 (45.5)       140 (54.5)       69 (26.8)        188 (73.2)
             1                                     113 (29.8)       266 (70.2)       79 (20.8)        300 (79.2)
             0                                     83 (13.0)        556 (87.0)       83 (13.0)        556 (87.0)
            Sex
             Female                                191 (26.2)       538 (73.8)       147 (20.2)       582 (79.8)
             Male                                  122 (22.3)       424 (77.7)       84 (15.4)        462 (84.6)
            Equvivalized parental income (ages 7 – 10)
             Low                                   108 (27.3)       287 (72.7)       73 (18.4)        322 (81.5)
             Medium                                100 (23.3)       329 (76.7)       82 (19.1)        347 (80.9)
             High                                  105 (23.3)       346 (76.7)       76 (16.9)        375 (83.1)
            Parental educational level (age 15)
             <10 years                             51 (31.5)        111 (68.5)       33 (20.0)        132 (80.8)
             10 – 13 years                         143 (22.9)       481 (77.1)       104 (16.7)       520 (83.3)
             >13 years                             116 (23.9)       370 (76.1)       94 (19.3)        392 (80.7)
            Own educational level
             <10 years                             22 (39.3)        34 (60.7)        12 (21.4)        44 (78.6)
             10 – 13 years                         98 (24.5)        302 (75.5)       69 (17.3)        331 (82.8)
             >13 years                             793 (55.9)       626 (44.1)       150 (18.3)       669 (81.7)
            Forms of employment
             Temporarily employed                  67 (32.5)        139 (67.5)       32 (15.5)        174 (84.5)
             Permanently employed                  246 (23.0)       823 (77.0)       199 (18.6)       870 (81.4)
            Psychosocial work climate
             Poor                                  45 (46.0)        53 (54.1)        49 (48.5)        52 (51.5)
             Good                                  268 (22.8)       906 (77.2)       182 (15.5)       992 (84.5)
            Work-life balance
             Poor                                  115 (47.1)       129 (52.9)       98 (40.2)       146  (59.8)
             Good                                  198 (19.2)       833 (80.8)       133 (12.9)       898 (87.1)
            Work justice
             Poor                                  146 (44.5)       182 (55.5)       107 (32.6)       221 (67.4)
             Good                                  167 (17.6)       780 (82.4)       124 (13.1)       823 (86.9)
            Worries about losing job
             Many                                  150 (40.0)       225 (60.0)       90 (24.0)        285 (76.0)
             Few                                   163 (18.1)       737 (82.9)       141 (15.7)       759 (84.3)

            Volume 11 Issue 4 (2025)                        30                        https://doi.org/10.36922/ijps.0864
   31   32   33   34   35   36   37   38   39   40   41