Page 37 - IJPS-11-4
P. 37

International Journal of
            Population Studies                                                              Stress in early adulthood


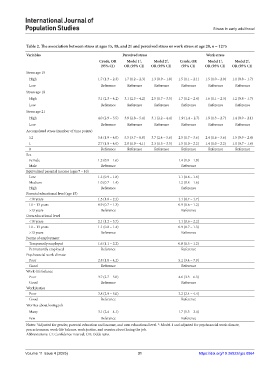
            Table 2. The association between stress at ages 15, 18, and 21 and perceived stress or work stress at age 28, n = 1275
            Variables                                Perceived stress                    Work stress
                                                                        §
                                                                                               †
                                           Crude, OR   Model 1 ,   Model 2 ,   Crude, OR   Model 1 ,   Model 2 ,
                                                            †
                                                                                                          §
                                            (95% CI)  OR (95% CI)  OR (95% CI)  (95% CI)  OR (95% CI)  OR (95% CI)
            Stress age 15
             High                          1.7 (1.3 – 2.3)  1.7 (1.2 – 2.3)  1.3 (0.9 – 1.8)  1.5 (1.1 – 2.1)  1.5 (1.0 – 2.0)  1.1 (0.8 – 1.7)
             Low                            Reference  Reference   Reference  Reference   Reference  Reference
            Stress age 18
             High                          3.1 (2.3 – 4.2)  3.1 (2.3 – 4.2)  2.5 (1.7 – 3.5)  1.7 (1.2 – 2.4)  1.6 (1.1 – 2.3)  1.2 (0.8 – 1.7)
             Low                            Reference  Reference   Reference  Reference   Reference  Reference
            Stress age 21
             High                          4.0 (2.9 – 5.5)  3.9 (2.8 – 5.4)  3.1 (2.2 – 4.4)   1.9 (1.4 – 2.7)  1.9 (1.3 – 2.7)  1.4 (0.9 – 2.1)
             Low                            Reference  Reference   Reference  Reference   Reference  Reference
            Accumulated stress (number of time points)
             ≥2                            5.4 (1.9 – 4.0)  5.5 (3.7 – 8.0)  3.7 (2.4 – 5.6)  2.5 (1.7 – 3.6)  2.4 (1.6 – 3.6)  1.5 (0.9 – 2.4)
             1                             2.7 (1.9 – 4.0)  2.8 (1.9 – 4.1)  2.3 (1.5 – 3.5)  1.5 (1.0 – 2.2)  1.4 (1.0 – 2.2)  1.0 (0.7 – 1.6)
             0                              Reference  Reference   Reference  Reference   Reference  Reference
            Sex
             Female                        1.2 (0.9 – 1.6)                   1.4 (1.0 – 1.9)
             Male                           Reference                         Reference
            Equivalized parental income (ages 7 – 10)
             Low                           1.3 (0.9 – 1.8)                   1.1 (0.8 – 1.6)
             Medium                        1.0 (0.7 – 1.4)                   1.2 (0.8 – 1.6)
             High                           Reference                         Reference
            Parental educational level (age 15)
             <10 years                     1.5 (1.0 – 2.3)                   1.1 (0.7 – 1.7)
             10 – 13 years                 0.9 (0.7 – 1.3)                   0.9 (0.6 – 1.2)
             >13 years                      Reference                         Reference
            Own educational level
             <10 years                     2.1 (1.2 – 3.7)                   1.1 (0.6 – 2.2)
             10 – 13 years                 1.1 (0.8 – 1.4)                   0.9 (0.7 – 1.3)
             >13 years                      Reference                         Reference
            Forms of employment
             Temporarily employed          1.6 (1.1 – 2.2)                   0.8 (0.5 – 1.2)
             Permanently employed           Reference                         Reference
            Psychosocial work climate
             Poor                          2.8 (1.8 – 4.2)                   5.2 (3.4 – 7.9)
             Good                           Reference                         Reference
            Work-life balance
             Poor                          3.7 (2.7 – 5.0)                   4.6 (3.3 – 6.3)
             Good                           Reference                         Reference
            Work justice
             Poor                          3.8 (2.9 – 5.0)                   3.2 (2.4 – 4.4)
             Good                           Reference                         Reference
            Worries about losing job
             Many                          3.1 (2.4 – 4.1)                   1.7 (1.3 – 2.4)
             Few                            Reference                         Reference
            Notes:  Adjusted for gender, parental education and income, and own educational level.  : Model 1 and adjusted for psychosocial work climate,
                                                                    §
                 †
            precariousness, work-life balance, work justice, and worries about losing the job.
            Abbreviations: CI: Confidence interval; OR: Odds ratio.

            Volume 11 Issue 4 (2025)                        31                        https://doi.org/10.36922/ijps.0864
   32   33   34   35   36   37   38   39   40   41   42