
Page 148 - IJPS-11-5
P. 148
International Journal of
Population Studies Fertility desire of married women
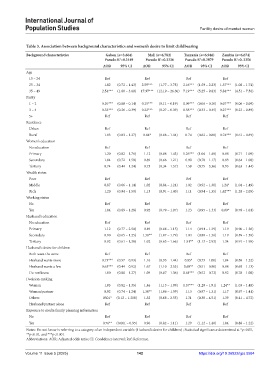
Table 3. Association between background characteristics and women’s desire to limit childbearing
Background characteristics Gabon (n=3,664) Mali (n=6,782) Tanzania (n=6,946) Zambia (n=6,674)
Pseudo R =0.2149 Pseudo R =0.3236 Pseudo R =0.2879 Pseudo R =0. 3256
2
2
2
2
AOR 95% CI AOR 95% CI AOR 95% CI AOR 95% CI
Age
15 – 24 Ref Ref Ref Ref
25 – 34 1.02 (0.72 – 1.43) 2.59*** (1.77 – 3.78) 2.16*** (1.59 – 2.23) 1.37*** (1.08 – 1.74)
35 – 49 2.54*** (1.80 – 3.60) 17.97*** (12.19 – 26.30) 7.19*** (5.25 – 9.83) 5.84*** (4.51 – 7.56)
Parity
1 – 2 0.10*** (0.08 – 0.14) 0.15*** (0.11 – 0.19) 0.09*** (0.06 – 0.10) 0.07*** (0.06 – 0.09)
3 – 4 0.32*** (0.26 – 0.39) 0.32*** (0.27 – 0.39) 0.38*** (0.33 – 0.45) 0.27*** (0.23 – 0.89)
5+ Ref Ref Ref Ref
Residence
Urban Ref Ref Ref Ref
Rural 1.03 (0.83 – 1.27) 0.84* (0.68 – 1.04) 0.74 (0.62 – 0.88) 0.74*** (0.61 – 0.89)
Women’s education
No education Ref Ref Ref Ref
Primary 1.20 (0.82 – 1.76) 1.12 (0.88 – 1.43) 1.26*** (1.06 – 1.48) 0.88 (0.71 – 1.09)
Secondary 1.04 (0.72 – 1.50) 0.89 (0.66 – 1.21) 0.90 (0.70 – 1.17) 0.83 (0.64 – 1.08)
Tertiary 0.74 (0.44 – 1.24) 0.73 (0.34 – 1.57) 1.59 (0.75 – 3.36) 0.95 (0.63 – 1.44)
Wealth status
Poor Ref Ref Ref Ref
Middle 0.87 (0.66 – 1.14) 1.02 (0.84 – 1.24) 1.02 (0.92 – 1.30) 1.24* (1.04 – 1.49)
Rich 1.20 (0.94 – 1.50) 1.13 (0.91 – 1.40) 1.11 (0.94 – 1.35) 1.62*** (1.28 – 2.05)
Working status
No Ref Ref Ref Ref
Yes 1.04 (0.89 – 1.28) 0.92 (0.79 – 1.07) 1.23 (0.95 – 1.33) 0.89* (0.78 – 1.01)
Husband’s education
No education Ref Ref Ref Ref
Primary 1.12 (0.77 – 2.50) 0.89 (0.68 – 1.15) 1.14 (0.94 – 1.39) 1.19 (0.90 – 1.56)
Secondary 0.90 (0.65 – 1.25) 1.38** (1.07 – 1.79) 1.04 (0.80 – 1.36) 1.19 (0.89 – 1.58)
Tertiary 0.92 (0.61 – 1,38) 1.02 (0.63 – 1.66) 1.81** (1.13 – 2.93) 1.34 (0.91 – 1.98)
Husband’s desire for children
Both want the same Ref Ref Ref Ref
Husband wants more 0.73*** (0.57 – 0.93) 1.16 (0.93 – 1.44) 0.85* (0.73 – 1.00) 1.04 (0.88 – 1.22)
Husband wants a few 0.63*** (0.44 – 0.92) 1.67 (1.10 – 2.53) 0.68** (0.51 – 0.90) 0.88 (0.69 – 1.13)
Do not know 1.00 (0.80 – 1.27) 1.09 (0.87 – 1.36) 0.61*** (0.52 – 0.72) 0.92 (0.78 – 1.08)
Decision-making
Woman 1.05 (0.82 – 1.35) 1.46 (1.13 – 1.09) 1.57*** (1.29 – 1.91) 1.24** (1.03 – 1.48)
Woman/partner 0.92 (0.74 – 1.24) 1.30** (1.06 – 1.59) 1.13 (0.97 – 1.31) 1.17 (0.97 – 1.41)
Others 0501* (0.12 – 1.208) 1.32 (0.68 – 2.55) 1.31 (0.38 – 4.51) 1.39 (0.41 – 4.72)
Husband/partner alone Ref Ref Ref Ref
Exposure to media family planning information
No Ref Ref Ref Ref
Yes 0.76** (0.001 – 0.95) 0.96 (0.82 – 1.11) 1.29 (1.12 – 1.48) 1.04 (0.88 – 1.22)
Notes: Do not know is referring to a category of an independent variable (Husband’s desire for children) ; Statistical significance determined at *p<0.05,
**p<0.01, and ***p<0.001.
Abbreviations: AOR: Adjusted odds ratio; CI: Confidence interval; Ref: Reference.
Volume 11 Issue 5 (2025) 142 https://doi.org/10.36922/ijps.5584