
Page 162 - IJPS-11-5
P. 162
International Journal of
Population Studies Contraception and fertility in Zambia
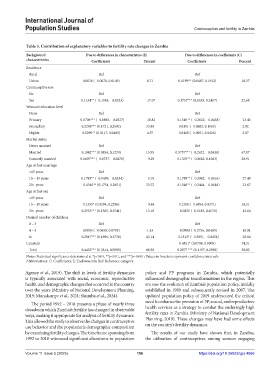
Table 3. Contribution of explanatory variables to fertility rate changes in Zambia
Background Due to differences in characteristics (E) Due to differences in coefficients (C)
characteristics Coefficients Percent Coefficients Percent
Residence
Rural Ref Ref
Urban 0.0036 (−0.0078, 0.0149) 0.71 0.1199** (0.0487, 0.1912) 18.37
Contraceptive use
No Ref Ref
Yes −0.1154** (−0.1985, −0.0323) −17.67 0.1757*** (0.0555, 0.2407) 22.68
Woman’s education level
None Ref Ref
Primary −0.0706*** (−0.0885, −0.0527) −10.82 −0.1510** (−0.2622, −0.0438) −23.43
Secondary 0.2206*** (0.1721, 0.2692) 33.80 0.0191 (−0.0682, 0.1063) 2.92
Higher 0.0299** (0.0117, 0.0480) 4.57 0.0188 (−0.0051, 0.0426) 2.87
Marital status
Never married Ref Ref
Married 0.1042*** (0.0854, 0.1230) 15.95 0.5737*** (−0.2622, −0.0438) 67.87
Formerly married −0.0607*** (−0.0737, −0.0476) −9.29 0.1365** (−0.0682, 0.1063) 20.91
Age at first marriage
<15 years Ref Ref
15 – 19 years −0.1789** (−0.0499, −0.0254) −5.76 −0.1789** (−0.2962, −0.0616) −27.40
20+ years −0.1545** (0.1751, 0.2651) 33.72 −0.1546** (−0.2444, −0.0646) −23.67
Age at first sex
<15 years Ref Ref
15 – 19 years 0.1295* (0.0294, 0.2296) −9.84 0.1208 (−0.6954, 0.9371) 18.51
20+ years 0.2553*** (0.1565, 0.3541) 13.10 −0.0825 (−0.6180, 0.4530) −12.64
Desired number of children
0 – 3 Ref Ref
4 – 5 0.0093 (−0.0608, 0.0795) 1.43 −0.0900 (−0.2756, 0.0405) −18.01
6+ 0.2817*** (0.1896, 0.3738) 43.14 −0.1512* (−0.3051, −0.0454) −26.84
Constant 0.4851* (0.0798, 0.8905) 74.31
Total 0.4452*** (0.3814, 0.5090) 68.98 0.2077 *** (0.1197, 0.2956) 30.02
Notes: Statistical significance determined at *p<0.05, **p<0.01, and ***p=0.001; Values in brackets represent confidence intervals.
Abbreviations: C: Coefficients; E: Endowments; Ref: Reference category.
Agency et al., 2019). The shift in levels of fertility dynamics policy and FP programs in Zambia, which potentially
is typically associated with social, economic, reproductive influenced demographic transformations in the region. This
health, and demographic changes that occurred in the country era saw the evolution of Zambia’s population policy, initially
over the years (Ministry of National Development Planning, established in 1989 and subsequently revised in 2007. The
2019; Munakampe et al., 2021; Shumba et al., 2024). updated population policy of 2019 underscored the critical
The period 1992 – 2018 presents a phase of nearly three need to enhance the provision of FP, sexual, and reproductive
decades in which Zambia’s fertility has changed in observable health services as a strategy to combat the enduringly high
ways, making it appropriate for analysis of fertility dynamics. fertility rates in Zambia (Ministry of National Development
This allowed the study to observe the changes in contraceptive Planning, 2019). These changes may have had some effects
use behavior and the population’s demographic composition on the country’s fertility dynamics.
by examining fertility changes. The timeframe spanning from The results of our study have shown that, in Zambia,
1992 to 2018 witnessed significant alterations in population the utilization of contraceptives among women engaging
Volume 11 Issue 5 (2025) 156 https://doi.org/10.36922/ijps.4866