
Page 161 - IJPS-11-5
P. 161
International Journal of
Population Studies Contraception and fertility in Zambia
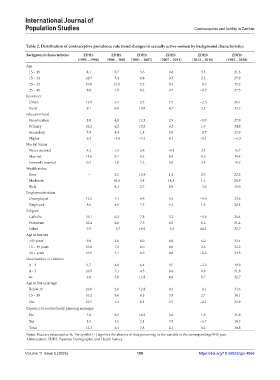
Table 2. Distribution of contraceptive prevalence rate trend changes in sexually active women by background characteristics
Background characteristics ZDHS ZDHS ZDHS ZDHS ZDHS ZDHS
(1992 – 1996) 1996 – 2001 (2001 – 2007) (2007 – 2013) (2013 – 2018) (1992 – 2018)
Age
15 – 19 8.1 5.7 3.6 0.6 3.3 21.3
15 – 24 10.7 5.4 8.8 0.7 2.3 27.9
25 – 34 10.9 11.0 5.2 8.4 −0.3 35.2
35 – 49 8.8 1.9 8.2 9.7 −0.3 27.5
Residence
Urban 12.9 6.7 3.5 7.5 −2.5 28.1
Rural 9.1 6.8 10.8 4.7 2.3 33.7
Education level
No education 8.8 4.8 12.3 2.9 −0.9 27.9
Primary 10.3 6.2 10.2 6.2 1.9 34.8
Secondary 7.9 8.4 1.4 5.9 −0.7 22.9
Higher 6.4 −4.6 −7.1 8.1 −9.1 −6.3
Marital Status
Never married 8.2 1.5 3.8 −0.1 3.3 16.7
Married 13.6 8.7 8.2 8.4 0.5 39.4
Formerly married 0.2 1.0 7.2 5.9 5.4 19.7
Wealth status
Poor − 2.5 15.9 1.3 2.9 22.3
Moderate − 10.1 3.4 14.3 1.1 28.9
Rich − 8.1 2.7 6.8 −2.6 15.0
Employment status
Unemployed 12.5 7.4 8.8 5.9 −1.0 33.6
Employed 8.6 4.9 7.3 6.2 1.4 28.4
Religion
Catholic 10.1 6.3 7.8 5.2 −1.0 28.4
Protestant 10.4 6.8 7.5 6.5 0.2 31.4
Other 9.3 −3.7 19.2 −5.3 14.2 33.7
Age at first sex
<15 years 9.0 5.6 8.0 4.8 6.0 33.4
15 – 19 years 10.8 7.2 8.0 4.0 2.2 32.2
20 + years 10.9 5.1 6.9 8.8 −8.2 23.5
Ideal number of children
0 – 3 6.7 4.8 6.4 3.5 −2.2 19.2
4 – 5 10.9 7.1 4.5 8.4 0.9 31.8
6+ 9.6 5.0 12.8 4.6 0.7 32.7
Age at first marriage
Below 15 10.0 2.6 12.8 9.3 −1.1 33.6
15 – 19 10.2 9.0 8.3 7.9 2.7 38.1
20+ 10.7 1.2 8.4 3.7 −0.1 23.9
Exposure to media family planning messages
No 7.6 6.5 10.2 5.6 1.9 31.8
Yes 8.5 5.5 2.1 7.9 −5.7 18.3
Total 12.3 6.4 7.8 6.1 0.2 30.8
Notes: Data are presented as %; The symbol (−) signifies the absence of data pertaining to the variable in the corresponding DHS year.
Abbreviation: ZDHS: Zambia’s Demographic and Health Survey.
Volume 11 Issue 5 (2025) 155 https://doi.org/10.36922/ijps.4866