
Page 159 - IJPS-11-5
P. 159
International Journal of
Population Studies Contraception and fertility in Zambia
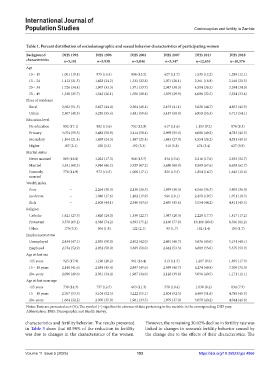
Table 1. Percent distribution of sociodemographic and sexual behavior characteristics of participating women
Background DHS 1992 DHS 1996 DHS 2001 DHS 2007 DHS 2013 DHS 2018
characteristics n=5,181 n=5,938 n=5,844 n=5,347 n=12,653 n=10,576
Age
15 – 19 1,001 (19.4) 975 (16.5) 886 (15.2) 627 (11.7) 1,535 (12.2) 1,280 (12.1)
15 – 24 1,112 (21.5) 1,428 (24.2) 1,332 (22.8) 1,071 (20.1) 2,361 (18.8) 2,168 (20.5)
25 – 34 1,726 (34.4) 1,967 (33.3) 1,971 (33.7) 2,047 (38.3) 4,594 (36.5) 3,594 (34.0)
35 – 49 1,330 (25.7) 1,542 (26.1) 1,656 (28.4) 1,595 (29.9) 4,088 (32.5) 3,524 (33.4)
Place of residence
Rural 2,662 (51.5) 2,627 (44.4) 2,364 (40.4) 2,193 (41.1) 5,628 (44.7) 4,853 (45.9)
Urban 2,507 (48.5) 3,285 (55.6) 3,481 (59.6) 3,147 (58.9) 6,950 (55.3) 5,713 (54.1)
Education level
No education 882 (17.1) 802 (13.6) 752 (12.9) 617 (11.6) 1,153 (9.2) 876 (8.3)
Primary 3,074 (59.5) 3,482 (58.9) 3,414 (58.4) 2,969 (55.6) 6,088 (49.2) 4,783 (45.3)
Secondary 1,104 (21.4) 1,439 (24.3) 1,487 (25.4) 1,443 (27.0) 4,554 (36.2) 4,281 (40.5)
Higher 107 (2.1) 188 (3.2) 192 (3.3) 310 (5.8) 674 (5.4) 627 (5.9)
Marital status
Never married 869 (16.8) 1,022 (17.3) 916 (15.7) 834 (15.6) 2,216 (17.6) 2,293 (21.7)
Married 3,531 (68.3) 3,916 (66.2) 3,929 (67.2) 3,680 (68.9) 8,509 (67.6) 6,629 (62.7)
Formerly 770 (14.9) 973 (16.5) 1,000 (17.1) 826 (15.5) 1,854 (14.7) 1,643 (15.6)
married
Wealth index
Poor − 2,264 (38.3) 2,136 (36.5) 1,939 (36.3) 4,566 (36.3) 3,803 (36.0)
moderate − 1,040 (17.6) 1,162 (19.9) 966 (18.1) 2,458 (19.5) 1,951 (18.5)
Rich − 2,608 (44.1) 2,546 (43.6) 2,435 (45.6) 5,554 (44.2) 4,811 (45.5)
Religion
Catholic 1,421 (27.5) 1,420 (24.0) 1,330 (22.7) 1,087 (20.3) 2,229 (17.7) 1,817 (17.2)
Protestant 3,578 (69.2) 4,388 (74.2) 4,393 (75.2) 4,160 (77.9) 10,166 (80.8) 8,566 (81.2)
Other 170 (3.3) 104 (1.8) 122 (2.1) 93 (1.7) 182 (1.4) 183 (1.7)
Employment status
Unemployed 2,434 (47.1) 2,955 (50.0) 2,452 (42.0) 2,491 (46.7) 5,636 (45.0) 5,191 (49.1)
Employed 2,734 (52.9) 2,952 (50.0) 3,389 (58.0) 2,842 (53.3) 6,889 (55.0) 5,375 (50.9)
Age at first sex
<15 years 925 (17.9) 1,196 (20.2) 961 (16.4) 613 (11.5) 1,207 (9.6) 1,895 (17.9)
15 – 19 years 2,148 (41.6) 2,684 (45.4) 2,897 (49.6) 2,599 (48.7) 6,274 (49.8) 7,500 (71.0)
20+ years 2,096 (40.6) 2,031 (34.4) 1,987 (34.0) 2,128 (39.8) 5,096 (40.5) 1,171 (11.1)
Age at first marriage
<15 years 738 (14.3) 737 (12.5) 663 (11.3) 558 (10.4) 1,030 (8.2) 834 (7.9)
15 – 19 years 2,767 (53.5) 3,104 (52.5) 3,222 (55.1) 2,804 (52.5) 6,489 (51.6) 4,788 (45.3)
20+ years 1,664 (32.2) 2,070 (35.0) 1,961 (33.5) 1,979 (37.0) 5,059 (40.2) 4,944 (46.8)
Notes: Data are presented as n (%); The symbol (−) signifies the absence of data pertaining to the variable in the corresponding DHS year.
Abbreviation: DHS: Demographic and Health Survey.
characteristics and fertility behavior. The results presented However, the remaining 30.02% decline in fertility rate was
in Table 3 show that 68.98% of the reduction in fertility linked to changes in women’s fertility behavior caused by
was due to changes in the characteristics of the women. the change due to the effects of their characteristics. The
Volume 11 Issue 5 (2025) 153 https://doi.org/10.36922/ijps.4866