
Page 50 - IJPS-11-5
P. 50
International Journal of
Population Studies Need for social services among disabled older Chinese
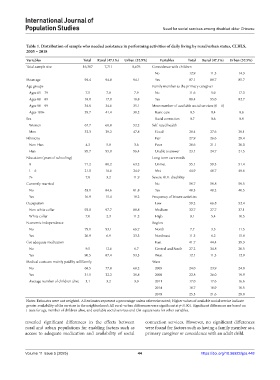
Table 1. Distribution of sample who needed assistance in performing activities of daily living by rural/urban status, CLHLS,
2005 – 2018
Variables Total Rural (47.1%) Urban (52.9%) Variables Total Rural (47.1%) Urban (52.9%)
Total sample size 16,387 7,711 8,676 Coresidence with children
No 12.9 11.3 14.3
Mean age 94.4 94.8 94.1 Yes 87.1 88.7 85.7
Age groups Family member as the primary caregiver
Ages 65 – 79 7.5 7.0 7.9 No 11.6 5.0 17.3
Ages 80 – 89 18.0 17.0 18.8 Yes 88.4 95.0 82.7
Ages 90 – 99 34.8 34.6 35.1 Mean number of available social services (0 – 4)
Ages 100+ 39.7 41.4 38.2 Basic care 0.5 0.4 0.6
Sex Social connection 0.7 0.6 0.9
Women 67.7 60.8 52.2 Self-rated health
Men 32.3 29.2 47.8 Good 28.4 27.6 29.1
Ethnicity Fair 27.9 26.6 29.4
Non-Han 4.3 5.0 3.6 Poor 20.6 21.1 20.0
Han 95.7 95.0 96.4 Unable to answer 23.1 24.7 21.5
Education (years of schooling) Long-term care needs
0 71.2 80.2 63.2 Unmet 55.1 59.3 51.4
1 – 6 21.0 16.6 24.9 Met 44.9 40.7 48.6
7+ 7.8 3.2 11.9 Severe ADL disability
Currently married No 59.7 59.8 59.5
No 83.1 84.6 81.8 Yes 40.3 40.2 40.5
Yes 16.9 15.4 18.2 Frequency of leisure activities
Occupation Low 59.2 66.8 52.4
Non-white collar 93.0 97.7 88.8 Medium 32.7 27.7 37.1
White collar 7.0 2.3 11.2 High 8.1 5.4 10.5
Economic independence Region
No 79.1 93.1 66.7 North 7.7 3.3 11.5
Yes 20.9 6.9 33.3 Northeast 11.3 6.2 15.8
Got adequate medication East 41.7 44.4 39.3
No 9.5 12.6 6.7 Central and South 27.2 34.8 20.5
Yes 90.5 87.4 93.3 West 12.1 11.3 12.9
Medical costs are mainly paid by self/family Wave
No 68.5 77.8 60.2 2005 24.0 23.9 24.0
Yes 31.5 22.2 39.8 2008 22.8 26.0 19.9
Average number of children alive 3.1 3.2 3.0 2011 17.0 17.6 16.6
2014 10.7 10.9 10.5
2018 25.5 21.6 29.0
Notes: Estimates were not weighted. All estimates represent a percentage unless otherwise noted; Higher values of available social service indicate
greater availability of the services in the neighborhood; All rural–urban differences were significant at p<0.001. Significant differences are based on
t-tests for age, number of children alive, and available social services and Chi-square tests for other variables.
revealed significant differences in the effects between connection services. However, no significant differences
rural and urban populations for enabling factors such as were found for factors such as having a family member as a
access to adequate medication and availability of social primary caregiver or coresidence with an adult child.
Volume 11 Issue 5 (2025) 44 https://doi.org/10.36922/ijps.448