
Page 52 - IJPS-11-5
P. 52
International Journal of
Population Studies Need for social services among disabled older Chinese
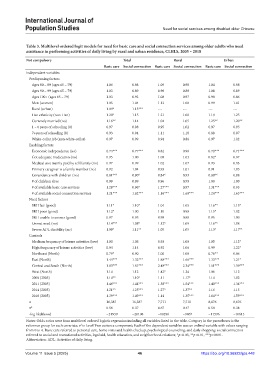
Table 3. Multilevel ordered logit models for need for basic care and social connection services among older adults who need
assistance in performing activities of daily living by rural and urban residence, CLHLS, 2005 – 2018
Not compulsory Total Rural Urban
Basic care Social connection Basic care Social connection Basic care Social connection
Independent variables
Predisposing factors
Ages 80 – 89 (ages 65 – 79) 1.06 0.98 1.09 0.98 1.04 0.98
Ages 90 – 99 (ages 65 – 79) 1.03 0.89 0.96 0.88 1.08 0.89
Ages 100+ (ages 65 – 79) 1.03 0.92 1.08 0.97 0.98 0.86
Men (women) 1.05 1.04 1.13 1.08 0.99 1.01
Rural (urban) 1.09* 1.13*** --- --- --- ---
Han ethnicity (non-Han) 1.20* 1.15 1.21 1.08 1.19 1.25
Currently married (no) 1.16** 1.14 1.04 1.05 1.25** 1.20**
1 – 6 years of schooling (0) 0.97 0.98 0.95 1.02 0.97 0.95
7+years of schooling (0) 0.93 0.94 1.11 1.18 0.88 0.87
White-collar job (non-white-collar) 0.97 0.99 0.94 0.86 0.97 1.02
Enabling factors
Economic independence (no) 0.74*** 0.77*** 0.82 0.90 0.70*** 0.71***
Got adequate medication (no) 0.95 1.00 1.08 1.03 0.82* 0.97
Medical cost mainly paid by self/family (no) 0.97 0.99 1.02 1.07 0.93 0.93
Primary caregiver is a family member (no) 0.92 1.04 0.93 1.01 0.91 1.05
Coresidence with children (no) 0.81*** 0.90* 0.84* 0.93 0.80** 0.88
# of children alive 0.99 0.99 0.96 0.99 1.00 1.00
# of available basic care services 1.28*** 0.96* 1.27*** 0.97 1.31*** 0.95
# of available social connection services 1.21*** 1.62*** 1.16*** 1.60*** 1.24*** 1.63***
Need factors
SRH fair (good) 1.11* 1.10* 1.04 1.05 1.16** 1.15*
SRH poor (good) 1.12* 1.00 1.10 0.98 1.15* 1.02
SRH unable to answer (good) 0.97 0.95 0.98 0.88 0.95 1.00
Unmet need (no) 1.14*** 1.08* 1.12* 1.09 1.16** 1.08
Severe ADL disability (no) 1.09* 1.11** 1.05 1.05 1.13* 1.17**
Controls
Medium frequency of leisure activities (low) 1.00 1.06 0.93 1.00 1.05 1.12*
High frequency of leisure activities (low) 0.94 1.14 0.92 1.06 0.99 1.22*
Northeast (North) 0.79* 0.90 1.00 1.08 0.76** 0.86
East (North) 1.44*** 1.32*** 1.88*** 1.66*** 1.33*** 1.21*
Central and South (North) 1.83*** 1.81*** 2.48*** 2.34*** 1.61*** 1.59***
West (North) 1.14 1.12 1.42* 1.24 1.06 1.12
2008 (2005) 1.14** 1.10* 1.11 1.17* 1.14 1.02
2011 (2005) 1.46*** 1.44*** 1.58*** 1.54*** 1.40*** 1.34***
2014 (2005) 1.21** 1.25*** 1.27* 1.37** 1.16 1.15
2018 (2005) 1.39*** 1.49*** 1.14 1.35*** 1.64*** 1.59***
n 16,387 16,387 7,711 7,711 8,676 8,676
σ 2 0.56 0.37 0.67 0.47 0.58 0.38
-log likelihood −21939 −20108 −10296 −9467 −11596 −10613
Notes: Odds ratios were from multilevel ordered logistic regression including all variables listed in the table. Category in the parentheses is the
reference group for each covariate; σ is Level Two variance component; Each of the dependent variables was an ordinal variable with values ranging
2
from 0 to 4. Basic care referred to personal care, home visits and health checkup, psychological counseling, and daily shopping; social connection
referred to social and recreational activities, legal aid, health education, and neighborhood relations; *p<0.05, **p<0.01, ***p<0.001.
Abbreviation: ADL: Activities of daily living.
Volume 11 Issue 5 (2025) 46 https://doi.org/10.36922/ijps.448