Page 30 - IJPS-2-2
P. 30

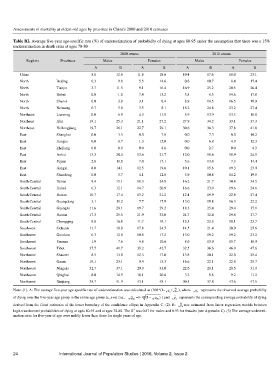
Assessments of mortality at oldest-old ages by province in China's 2000 and 2010 censuses

       Table B2. Average five-year age-specific rate (%) of underestimation of probability of dying at ages 80-95 under the assumption that there was a 15%
       underestimation in death rates at ages 70-80
                                                    2000 census                            2010 census
            Regions        Provinces         Males              Females             Males              Females
                                         A          B        A        B         A         B         A        B
          China                         5.8       12.6     11.6      18.6      10.4      17.6     18.0     23.1
          North          Beijing        0.3        9.8      5.5      14.6       0.6      10.7      8.4     17.4
          North          Tianjin        3.7       11.5      9.1      16.4      16.9      25.2     20.5     26.4
          North          Hebei          0.0        1.0      7.4      13.2       3.8       8.5     14.6     17.0
          North          Shanxi         0.0        3.9      3.1       8.4       8.9      14.5     16.5     19.9
          North          Neimeng        0.7        5.9      3.5       8.1      18.2      24.8     23.2     27.4
          Northeast      Liaoning       0.0        6.8      4.3      11.9       5.9      13.9     13.3     18.0
          Northeast      Jilin         19.1       25.3     21.1      27.2      27.9      34.2     33.1     37.3
          Northeast      Heilongjiang     19.7     26.1     22.7     29.1      30.6      36.3     37.8      41.8
          East           Shanghai       0.0        3.5      0.0       7.8       0.0       7.3      0.0      10.2
          East           Jiangsu        0.0        8.7      1.3      12.0       0.0       6.8      4.9      12.3
          East           Zhejiang       0.0        0.0      0.0       4.6       0.0       2.7      0.0      4.3
          East           Anhui         13.3       20.4     13.6      21.7      12.0      18.6     18.9     24.5
          East           Fujian         2.8       11.0      7.0      17.1       5.6      13.4      7.3     14.4
          East           Jiangxi        8.0       14.1     12.5      19.6      10.1      15.6     19.3     23.9
          East           Shandong       0.0        3.7      4.1      12.8       3.9      10.8     14.2     19.5
          South Central   Henan         9.4       15.1     18.3      24.8      16.2      21.7     30.8     34.5
          South Central   Hubei         6.3       12.1     14.7      20.9      16.6      23.0     19.6     24.6
          South Central   Hunan        10.7       17.4     13.2      21.2      12.4      19.9     22.6      27.4
          South Central   Guangdong     3.1        11.2     7.7      17.9      13.0      19.8     16.3      22.2
          South Central   Guangxi      11.6       20.1     19.7      29.2      18.3      25.4     29.4      35.1
          South Central   Hainan       17.3       25.5     21.9      32.0      24.7      32.4     29.8     37.7
          South Central   Chongqing     9.8       16.8     11.7      19.1      15.5      23.3     18.1     23.7
          Southwest      Sichuan       11.7       18.9     17.8      24.5      14.5      21.4     20.9     25.6
          Southwest      Guizhou        6.3       12.8     10.8      17.2      13.0      19.2     19.2     23.2
          Southwest      Yunnan         1.9        7.6      4.8      10.6       8.6      13.9     15.7     18.9
          Southwest      Tibet         37.7       41.7     38.2      42.7      32.5      36.6     46.0      47.6
          Northwest      Shaanxi        8.5       13.8     12.3      17.0      13.8      20.1     22.0      25.4
          Northwest      Gansu         19.1       23.1      9.4      13.3      16.6      22.1     22.8      25.7
          Northwest      Ningxia       32.7       37.1     29.0      33.0      22.6      28.1     28.5      31.0
          Northwest      Qinghai        8.0       14.5     16.1      20.6       3.3       8.8      9.2      11.2
          Northwest      Xinjiang      35.7       41.9     43.1      48.1      30.5      37.4     43.6     47.5
       Note: (1). A: The average five-year age-specific rate of underestimation was calculated as (100*(1− q / ˆ q ), where  q   represents the observed average probability
                                                                        n
                                                                         x
                                                                                     x
                                                                                   n
                                                                           n x
                                                                           ˆ
                                                                   q
       of dying over the five-year age group in the entire age group [x, x+n) (i.e.,   15 q =1- 1/3 (1−  15 80 ) ) and  q   represents the corresponding average probability of dying
                                                                          n x
                                                         80
                                                                              ˆ
       derived from the fitted estimates of the lower boundary of the confidence ellipse in Appendix C. (2). B:  q was estimated from linear regression models between
                                                                             n x
       logit-transformed probabilities of dying at ages 80-95 and at ages 70-80. The R  was 0.87 for males and 0.93 for females (see Appendix C). (3) The average underesti-
                                                          2
       mation rates for five-year of age were mildly lower than those for single years of age.
       24                 International Journal of Population Studies | 2016, Volume 2, Issue 2
   25   26   27   28   29   30   31   32   33   34   35