
Page 41 - IJPS-2-2
P. 41
Mukesh Ranjan, Laxmi Kant Dwivedi, Rahul Mishra, et al.
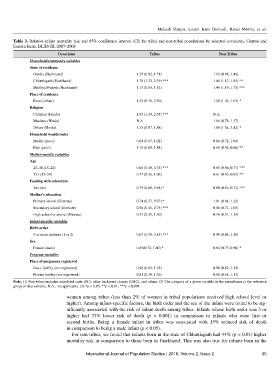
Table 3. Relative infant mortality risk and 95% confidence interval (CI) for tribal and non-tribal populations by selected covariates, Central and
Eastern India, DLHS-III, 2007–2008
Covariates Tribes Non-Tribes
Household/community variables
State of residence
Odisha (Jharkhand) 1.25 (0.92, 1.71) 1.13 (0.88, 1.44)
Chhattisgarh (Jharkhand) 1.78 (1.32, 2.39) *** 1.44 (1.13, 1.85) **
Madhya Pradesh (Jharkhand) 1.13 (0.85, 1.52) 1.44 (1.19, 1.73) ***
Place of residence
Rural (urban) 1.32 (0.76, 2.30) 1.29 (1.02, 1.63) *
Religion
Christian (Hindu) 1.85 (1.34, 2.55) *** N.A.
Muslims (Hindu) N.A. 1.04 (0.78, 1.37)
Others (Hindu) 1.35 (0.97, 1.88) 1.88 (1.04, 3.42) *
Household wealth index
Middle (poor) 0.69 (0.47, 1.02) 0.86 (0.72, 1.04)
Rich (poor) 1.10 (0.65, 1.88) 0.68 (0.54, 0.86) **
Mother-specific variables
Age
25–34 (15–24) 0.60 (0.49, 0.73) *** 0.65 (0.56, 0.77) ***
35+ (15–24) 0.77 (0.56, 1.06) 0.61 (0.45, 0.83) **
Feeding with colostrum
Yes (no) 0.79 (0.65, 0.98) * 0.60 (0.51, 0.71) ***
Mother’s education
Primary school (illiterate) 0.74 (0.57, 0.97) * 1.01 (0.84, 1.22)
Secondary school (illiterate) 0.56 (0.41, 0.75) *** 0.86 (0.71, 1.05)
High school or above (illiterate) 0.57 (0.25, 1.30) 0.76 (0.51, 1.13)
Infant-specific variables
Birth order
3 or more children (1 or 2) 0.67 (0.55, 0.83) *** 0.99 (0.84, 1.18)
Sex
Female (male) 0.85(0.72, 1.00) * 0.84 (0.73, 0.96) *
Program variables
Place of pregnancy registered
Govt. facility (not registered) 0.98 (0.82, 1.18) 0.96 (0.82, 1.12)
Private facility (not registered) 0.81 (0.48, 1.36) 0.88 (0.68, 1.14)
Note: (1) Non-tribes includes scheduled caste (SC), other backward classes (OBC), and others. (2) The category of a given variable in the parentheses is the reference
group of that variable. N.A.: not applicable. (3) *p < 0.05, **p < 0.01, ***p < 0.001.
women among tribes (less than 2% of women in tribal populations received high school level or
higher). Among infant-specific factors, the birth order and the sex of the infant were found to be sig-
nificantly associated with the risk of infant death among tribes. Infants whose birth order was 3 or
higher had 33% lower risk of death (p < 0.001) in comparison to infants who were first or
second births. Being a female infant in tribes was associated with 15% reduced risk of death
in comparison to being a male infant (p < 0.05).
For non-tribes, we found that infants born in the state of Chhattisgarh had 44% (p < 0.01) higher
mortality risk in comparison to those born in Jharkhand. This was also true for infants born in the
International Journal of Population Studies | 2016, Volume 2, Issue 2 35