
Page 16 - IJPS-3-1
P. 16
Exposure to urban life and mortality risk among older adults in China
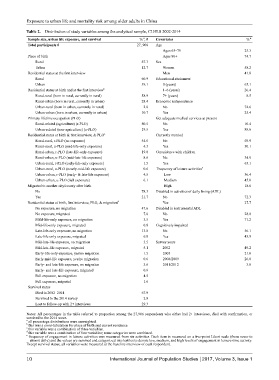
Table 2. Distribution of study variables among the analytical sample, CLHLS 2002-2014
Sample size, urban life exposure, and survival % , # Covariates % a
a
Total participants # 27, 906 Age
Ages 65–79 25.3
Place of birth Ages 80+ 74.7
Rural 87.3 Sex
Urban 12.7 Women 58.2
Residential status at the first interview Men 41.8
Rural 60.9 Educational attainment
Urban 39.1 0 (years) 65.1
Residential status at birth and at the first interview b 1–6 (years) 26.4
Rural-rural (born in rural, currently in rural) 58.9 7+ (years) 8.5
Rural-urban (born in rural, currently in urban) 28.4 Economic independence
Urban-rural (born in urban, currently in rural) 2.0 No 74.6
Urban-urban (born in urban, currently in urban) 10.7 Yes 25.4
Primary lifetime occupation (PLO) Get adequate medical services at present
Rural-related (agriculture) (r-PLO) 80.5 No 10.4
Urban-related (non-agriculture) (u-PLO) 19.5 Yes 89.6
Residential status at birth & first interview, & PLO c Currently married
Rural-rural, r-PLO (no exposure) 54.6 No 69.9
Rural-rural, u-PLO (mid-life-only exposure) 4.3 Yes 30.1
Rural-urban, r-PLO (late-life-only exposure) 19.8 Coresidence with children
Rural-urban, u-PLO (mid-late-life exposure) 8.6 No 34.9
Urban-rural, r-PLO (early-life-only exposure) 1.5 Yes 65.1
Urban-rural, u-PLO (nearly-mid-life exposure) 0.6 Frequency of leisure activities e
Urban-urban, r-PLO (early- & late-life exposure) 4.5 Low 36.4
Urban-urban, u-PLO (full exposure) 6.1 Medium 45.0
Migrated to another city/county after birth High 18.6
No 78.3 Disabled in activities of daily living (ADL)
Yes 21.7 No 72.3
Residential status at birth, first interview, PLO, & migration d Yes 27.7
No exposure, no migration 47.6 Disabled in instrumental ADL
No exposure, migrated 7.0 No 28.8
Mild-life-only exposure, no migration 3.5 Yes 71.2
Mid-life-only exposure, migrated 0.8 Cognitively impaired
Late-life-only exposure, no migration 13.8 No 56.1
Late-life-only exposure, migrated 6.0 Yes 43.9
Mid-late-life exposure, no migration 3.5 Survey years
Mid-late-life exposure, migrated 5.1 2002 49.2
Early-life-only exposure, yes/no migration 1.5 2005 21.0
Early-mid-life exposure, yes/no migration 0.6 2008/2009 26.0
Early- and late-life exposure, no migration 3.6 2011/2012 3.8
Early- and late-life exposure, migrated 0.9
Full exposure, no migration 4.5
Full exposure, migrated 1.6
Survival status
Died in 2002–2014 67.9
Survived to the 2014 survey 2.8
Lost to follow-up with 2+ interviews 29.3
Notes: All percentages in the table referred to proportion among the 27,906 respondents who either had 2+ interviews, died with confirmation, or
survived to the 2014 wave.
a all percentage distributions were unweighted.
b this was a cross-tabulation for place of birth and current residence.
c this variable was a combination of three variables.
d this variable was a combination of four variables; some categories were combined.
e frequency of engagement in leisure activities was measured from six activities. Each item is measured on a five-point Likert scale (from never to
almost daily) and the values are summed and categorized into tertiles to denote low, medium, and high levels of engagement in leisure-time activity.
Except survival status, all variables were measured at the baseline interview of each respondent.
10 International Journal of Population Studies 2017, Volume 3, Issue 1