
Page 17 - IJPS-3-1
P. 17
Gu D, Feng Q, Sautter JM and Qiu L
risk when controlling for demographics only (Model I), but had 7% higher mortality
risk when other covariates were controlled (Model II). Those with full exposure shared
a similar pattern as those with mid-late-life exposure. By contrast, early-life-only
exposure was associated with 14% higher mortality risk compared to no exposure, and
this higher risk was persistent when other covariates were added. Higher mortality risk
was also found for mid-life-only exposure when all covariates were controlled for.
The middle panel of Table 5 additionally splits the sample by migration. Results in
Model I suggest that in most cases, the results were similar to those in the upper panel.
Full exposure with migration was associated with 23% lower mortality risk compared
to no exposure without migration; however, the significance disappeared when other
covariates were added in Model II. At the same time, full exposure without migration
was only significant when all covariates were considered, with 12% higher mortality
risk.
We further tested the role of migration in the relation between each type of exposure
to urban life and mortality at older ages in Table 5 (see the low panel). We did not
observe a significant role of migration in most exposure types, except that migration
to another urban area was associated with 19% lower mortality risk when only age
and sex were controlled for (p < 0.05) and 14% lower mortality risk when all other
covariates were controlled for (p < 0.1).
4 Discussion
Based on five waves of the CLHLS, the current study examined the association
between exposure to urban life and mortality at older ages. This study expanded the
traditional approach of measuring exposure to urban life in terms of place of birth
and residence at older ages (Allender, Foster, Hutchinson, et al., 2008; Vlahov and
Galea, 2002; Wen and Gu, 2011; Xu, Dupre, Gu, et al., 2017; Zeng, Gu and Land,
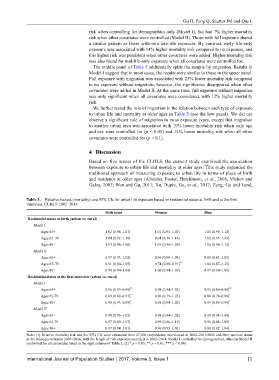
Table 3. Relative hazard (mortality) and 95% CIs for urban life exposure based on residential status at birth and at the first
interview, CLHLS 2002–2014
Both sexes Women Men
Residential status at birth (urban vs. rural)
Model I
Ages 65+ 1.02 (0.98–1.07) 1.01 (0.95–1.07) 1.05 (0.98–1.12)
Ages 65–79 1.04 (0.92–1.18) 0.94 (0.78–1.14) 1.12 (0.95–1.33)
Ages 80+ 1.03 (0.98–1.08) 1.03 (0.96–1.09) 1.04 (0.96–1.12)
Model II
Ages 65+ 0.97 (0.93–1.02) 0.96 (0.90–1.03) 0.98 (0.91–1.05)
Ages 65–79 0.91 (0.80–1.05) 0.74 (0.60–0.91) ** 1.04 (0.87–1.25)
Ages 80+ 0.99 (0.94–1.04) 1.00 (0.94–1.07) 0.97 (0.90–1.05)
Residential status at the first interview (urban vs. rural)
Model I
Ages 65+ 0.96 (0.93–0.99) ** 0.98 (0.94–1.02) 0.93 (0.89–0.98) **
Ages 65-79 0.89 (0.82–0.97) ** 0.90 (0.79–1.03) 0.88 (0.78–0.98) *
Ages 80+ 0.96 (0.93–0.99) * 0.98 (0.94–1.02) 0.93 (0.89–0.99) *
Model II
Ages 65+ 0.98 (0.95–1.02) 0.98 (0.94–1.02) 0.99 (0.94–1.04)
Ages 65-79 0.97 (0.89–1.07) 0.99 (0.86–1.15) 0.96 (0.84–1.09)
Ages 80+ 0.97 (0.94–1.01) 0.96 (0.93–1.01) 0.98 (0.92–1.04)
Note: (1) Relative mortality risk and the 95% CIs were estimated from 27,906 respondents interviewed in 2002–2011/2012 and their survival status
in the subsequent waves 2005–2014, with the length of risk exposure recorded in 2002–2014. Model I controlled for demographics, whereas Model II
controlled for all covariates listed in the right column of Table 2. (2) * p < 0.05, ** p < 0.01, *** p < 0.001.
International Journal of Population Studies 2017, Volume 3, Issue 1 11