
Page 19 - IJPS-3-1
P. 19
Gu D, Feng Q, Sautter JM and Qiu L
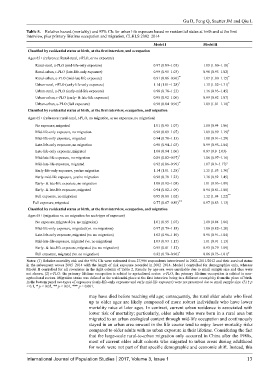
Table 5. Relative hazard (mortality) and 95% CIs for urban life exposure based on residential status at birth and at the first
interview, plus primary lifetime occupation and migration, CLHLS 2002–2014
Model I Model II
Classified by residential status at birth, at the first interview, and occupation
Ages 65+ (reference: Rural-rural, r-PLO, or no exposure)
Rural-rural, u-PLO (mid-life-only exposure) 0.97 (0.89–1.05) 1.09 (1.00–1.18) *
Rural-urban, r-PLO (late-life-only exposure) 0.99 (0.95–1.03) 0.98 (0.95–1.02)
Rural-urban, u-PLO (mid-late life exposure) 0.91 (0.86–0.96) ** 1.07 (1.00–1.15) *
Urban-rural, r-PLO (early-life-only exposure) 1.14 (1.01–1.28) * 1.15 (1.02–1.31) *
Urban-rural, u-PLO (early-mid-life exposure) 0.98 (0.78–1.23) 1.16 (0.93–1.45)
Urban-urban, r-PLO (early- & late-life exposure) 0.98 (0.92–1.06) 0.99 (0.92–1.07)
Urban-urban, u-PLO (full exposure) 0.90 (0.84–0.96) ** 1.09 (1.01–1.18) *
Classified by residential status at birth, at the first interview, occupation, and migration
Ages 65+ (reference: rural-rural, r-PLO, no migration, or no exposure, no migration)
No exposure, migrated 1.01 (0.95–1.07) 1.00 (0.94–1.06)
Mid-life-only exposure, no migration 0.98 (0.89–1.07) 1.09 (0.99–1.19) †
Mid-life-only exposure, migrated 0.94 (0.78–1.13) 1.08 (0.91–1.29)
Late-life-only exposure, no migration 0.98 (0.94–1.03) 0.99 (0.95–1.04)
Late-life-only exposure, migrated 1.00 (0.94–1.06) 0.97 (0.9–1.03)
Mid-late-life exposure, no migration 0.89 (0.82–0.97) * 1.06 (0.97–1.16)
Mid-late-life exposure, migrated 0.92 (0.86–0.99) * 1.07 (0.9–1.17) †
Early-life-only exposure, yes/no migration 1.14 (1.01–1.28) * 1.15 (1.03–1.30) *
Early-mid-life exposure, yes/no migration 0.98 (0.78–1.23) 1.16 (0.92–1.45)
Early- & late-life exposure, no migration 1.00 (0.92–1.08) 1.01 (0.93–1.09)
Early- & late-life exposure, migrated 0.94 (0.82–1.09) 0.94 (0.81–1.08)
Full exposure, no migration 0.95 (0.88–1.02) 1.12 (1.04–1.22) **
Full exposure, migrated 0.77 (0.67–0.89) *** 0.97 (0.83–1.13)
Classified by residential status at birth, at the first interview, occupation, and migration
Ages 65+ (migration vs. no migration for each type of exposure)
No exposure, migrated (vs. no migration) 1.01 (0.95–1.07) 1.00 (0.94–1.06)
Mid-life-only exposure, migrated (vs. no migration) 0.97 (0.79–1.18) 1.00 (0.82–1.20)
Late-life-only exposure, migrated (vs. no migration) 1.02 (0.96–1.10) 0.96 (0.91–1.04)
Mid-late-life exposure, migrated (vs. no migration) 1.03 (0.93–1.15) 1.01 (0.91–1.13)
Early- & late-life exposure, migrated (vs. no migration) 0.95 (0.81–1.12) 0.93 (0.79–1.09)
Full exposure, migrated (vs. no migration) 0.82 (0.70–0.96) * 0.86 (0.73–1.01) †
Notes: (1) Relative mortality risk and the 95% CIs were estimated from 27,906 respondents interviewed in 2002–2011/2012 and their survival status
in the subsequent waves 2005–2014 with the length of risk exposure recorded in 2002–2014. Model I controlled for demographics only, whereas
Model II controlled for all covariates in the right column of Table 2. Results by age-sex were unreliable due to small sample size and thus were
not shown. (2) r-PLO: the primary lifetime occupation is related to agricultural sector. u-PLO, the primary lifetime occupation is related to non-
agricultural sectors. Migration status was defined as the residential place at the first interview being in a different county/city from the place of birth.
In the bottom panel two types of exposures (early-life-only exposure and early-mid-life exposure) were not presented due to small sample size. (3) † p
< 0.1, * p < 0.05, ** p < 0.01, *** p < 0.001.
may have died before reaching old age; consequently, the rural older adults who lived
up to older ages are likely composed of more robust individuals who have lower
mortality rates at later ages. In contrast, current urban residence is associated with
lower risk of mortality; particularly, older adults who were born in a rural area but
migrated to an urban ecological context through mid-life occupation and continuously
stayed in an urban area onward in the life course tend to enjoy lower mortality risks
compared to older adults with no urban exposure in their lifetime. Considering the fact
that the large-scale rural-to-urban migration only occurred in China after the 1980s,
most of current older adult cohorts who migrated to urban areas during adulthood
for work were not part of that specific demographic and economic shift. Instead, this
International Journal of Population Studies 2017, Volume 3, Issue 1 13