
Page 55 - IJPS-3-1
P. 55
Yin N and Heiland F
2.2 Measurement
The work disability vignettes describe work limitation of a hypothetical character in
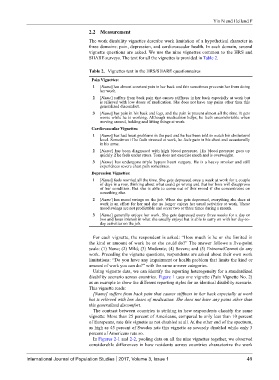
three domains: pain, depression, and cardiovascular health. In each domain, several
vignette questions are asked. We use the nine vignettes common to the HRS and
SHARE surveys. The text for all the vignettes is provided in Table 2.
Table 2. Vignettes text in the HRS/SHARE questionnaires
Pain Vignettes:
1 [Name] has almost constant pain in her back and this sometimes prevents her from doing
her work.
2 [Name] suffers from back pain that causes stiffness in her back especially at work but
is relieved with low doses of medication. She does not have any pains other than this
generalized discomfort.
3 [Name] has pain in his back and legs, and the pain is present almost all the time. It gets
worse while he is working. Although medication helps, he feels uncomfortable when
moving around, holding and lifting things at work.
Cardiovascular Vignettes:
1 [Name] has had heart problems in the past and he has been told to watch his cholesterol
level. Sometimes if he feels stressed at work, he feels pain in his chest and occasionally
in his arms.
2 [Name] has been diagnosed with high blood pressure. His blood pressure goes up
quickly if he feels under stress. Tom does not exercise much and is overweight.
3 [Name] has undergone triple bypass heart surgery. He is a heavy smoker and still
experiences severe chest pain sometimes.
Depression Vignettes:
1 [Name] feels worried all the time. She gets depressed once a week at work for a couple
of days in a row, thinking about what could go wrong and that her boss will disapprove
of her condition. But she is able to come out of this mood if she concentrates on
something else.
2 [Name] has mood swings on the job. When she gets depressed, everything she does at
work is an effort for her and she no longer enjoys her usual activities at work. These
mood swings are not predictable and occur two or three times during a month.
3 [Name] generally enjoys her work. She gets depressed every three weeks for a day or
two and loses interest in what she usually enjoys but is able to carry on with her day-to-
day activities on the job.
For each vignette, the respondent is asked: “How much is he or she limited in
the kind or amount of work he or she could do?” The answer follows a five-point
scale: (1) None; (2) Mild; (3) Moderate; (4) Severe; and (5) Extreme/Cannot do any
work. Preceding the vignette questions, respondents are asked about their own work
limitations: “Do you have any impairment or health problem that limits the kind or
amount of work you can do?” with the same answer categories.
Using vignette data, we can identify the reporting heterogeneity for a standardized
disability scenario across countries. Figure 1 uses one vignette (Pain Vignette No. 2)
as an example to show the different reporting styles for an identical disability scenario.
This vignette reads:
[Name] suffers from back pain that causes stiffness in her back especially at work
but is relieved with low doses of medication. She does not have any pains other than
this generalized discomfort.
The contrast between countries is striking in how respondents classify the same
vignette: More than 25 percent of Americans, compared to only less than 10 percent
of Europeans, rate this vignette as not disabled at all. At the other end of the spectrum,
as high as 45 percent of Swedes rate this vignette as severely disabled while only 3
percent of Americans rate so.
In Figures 2-1 and 2-2, pooling data on all the nine vignettes together, we observed
considerable differences in how residents across countries characterize the work
International Journal of Population Studies 2017, Volume 3, Issue 1 49