
Page 60 - IJPS-3-1
P. 60
Disability policies and public views on work disability...
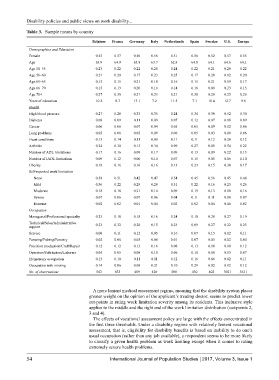
Table 3. Sample means by country
Belgium France Germany Italy Netherlands Spain Sweden U.S. Europe
Demographics and Education
Female 0.55 0.57 0.56 0.56 0.51 0.56 0.52 0.57 0.55
Age 63.9 64.9 63.8 63.7 62.8 64.8 64.1 64.6 64.1
Age 50–55 0.23 0.22 0.22 0.20 0.24 0.22 0.21 0.20 0.22
Age 56–60 0.21 0.20 0.17 0.23 0.25 0.17 0.20 0.12 0.20
Age 61–65 0.15 0.15 0.21 0.18 0.16 0.15 0.21 0.19 0.17
Age 66–70 0.15 0.13 0.20 0.16 0.14 0.16 0.09 0.23 0.15
Age 70+ 0.27 0.30 0.21 0.23 0.21 0.30 0.28 0.25 0.26
Years of education 10.2 8.3 13.1 7.2 11.5 7.1 10.4 12.7 9.6
Health
High blood pressure 0.27 0.28 0.33 0.35 0.24 0.34 0.30 0.52 0.30
Diabetes 0.08 0.09 0.11 0.09 0.07 0.12 0.07 0.18 0.09
Cancer 0.06 0.06 0.07 0.04 0.05 0.05 0.09 0.12 0.06
Lung problems 0.05 0.06 0.05 0.09 0.06 0.05 0.03 0.09 0.06
Heart conditions 0.13 0.14 0.11 0.09 0.11 0.11 0.12 0.20 0.12
Arthritis 0.24 0.30 0.13 0.34 0.09 0.27 0.09 0.54 0.22
Number of ADL limitations 0.17 0.16 0.09 0.17 0.09 0.13 0.09 0.22 0.13
Number of IADL limitations 0.09 0.12 0.06 0.14 0.07 0.15 0.05 0.16 0.10
Obesity 0.18 0.16 0.16 0.16 0.13 0.23 0.15 0.30 0.17
Self-reported work limitation
None 0.38 0.51 0.42 0.47 0.54 0.45 0.56 0.45 0.48
Mild 0.36 0.22 0.29 0.29 0.31 0.22 0.16 0.23 0.26
Moderate 0.18 0.18 0.21 0.14 0.09 0.19 0.13 0.18 0.16
Severe 0.07 0.06 0.07 0.06 0.04 0.11 0.11 0.08 0.07
Extreme 0.02 0.02 0.01 0.04 0.02 0.02 0.04 0.06 0.02
Occupation
Managerial/Professional specialty 0.23 0.18 0.18 0.16 0.24 0.10 0.28 0.27 0.19
Technical/Sales/Administrative 0.23 0.32 0.28 0.15 0.23 0.09 0.27 0.22 0.23
support
Service 0.08 0.11 0.12 0.05 0.16 0.07 0.15 0.12 0.11
Farming/Fishing/Forestry 0.02 0.06 0.03 0.06 0.01 0.07 0.03 0.02 0.04
Precision production/Craft/Repair 0.12 0.12 0.13 0.16 0.08 0.13 0.10 0.10 0.12
Operators/Fabricators/Laborers 0.05 0.05 0.08 0.10 0.06 0.10 0.08 0.13 0.07
Elementary occupation 0.13 0.10 0.11 0.11 0.12 0.16 0.06 0.02 0.11
Occupation info missing 0.14 0.06 0.08 0.21 0.10 0.29 0.02 0.12 0.12
No. of observations 543 833 489 426 508 430 402 3021 3631
A more lenient medical assessment regime, meaning that the disability system places
greater weight on the opinion of the applicant’s treating doctor, seems to predict lower
cut-points in rating work limitation severity among its residents. This inclusive style
applies to the middle and the right end of the work limitation distribution (cut-points 2,
3 and 4).
The effects of vocational assessment policy are large with the effects concentrated in
the first three thresholds. Under a disability regime with relatively lenient vocational
assessment, that is, eligibility for disability benefits is based on inability to do one’s
usual occupation (rather than any job available), a respondent seems to be more likely
to classify a given health problem as work limiting except when it comes to rating
extremely severe health problems.
54 International Journal of Population Studies 2017, Volume 3, Issue 1