
Page 61 - IJPS-3-1
P. 61
Yin N and Heiland F
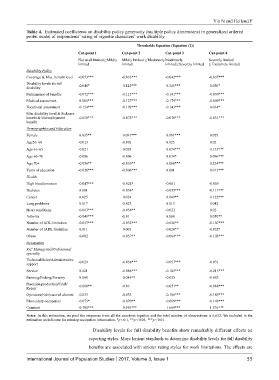
Table 4. Estimated coefficients on disability policy generosity (multiple policy dimensions) in generalized ordered
probit model of respondents’ rating of vignette characters’ work disability
Thresholds Equation (Equation (2))
Cut-point 1 Cut-point 2 Cut-point 3 Cut-point 4
Not at all limited ≥ Mildly Mildly limited ≥ Moderately Moderately Severely limited
limited limited limited ≥ Severely limited ≥ Extremely limited
Disability Policy
Coverage & Max. benefit level -0.053*** -0.033*** -0.042*** -0.037***
Disability levels for full
disability -0.040* 0.124*** 0.145*** 0.030*
Permanence of benefits -0.072*** -0.115*** -0.141*** -0.030***
Medical assessment 0.084*** -0.127*** -0.179*** -0.040***
Vocational assessment -0.154*** -0.192*** -0.143*** 0.034*
Min. disability level & Sickness
benefit & Unemployment -0.058*** -0.075*** -0.070*** -0.031***
benefit
Demographics and Education
Female 0.035** 0.091*** 0.081*** 0.029
Age56–60 -0.013 -0.001 0.025 0.02
Age 61–65 -0.021 0.029 0.074*** 0.153***
Age 66–70 -0.006 -0.006 0.034* 0.096***
Age 70+ -0.056** -0.039** 0.066*** 0.224***
Years of education -0.026*** -0.006*** 0.001 0.013***
Health
High blood pressure -0.047*** -0.024* -0.001 -0.009
Diabetes 0.001 -0.034* -0.055*** -0.111***
Cancer 0.025 0.024 0.049** 0.122***
Lung problems 0.017 -0.023 0.013 0.042
Heart conditions -0.063*** -0.038** -0.022 0.02
Arthritis -0.049*** -0.01 0.006 0.050**
Number of ADL limitation -0.057*** -0.032*** -0.026** -0.107***
Number of IADL limitation 0.011 0.005 -0.028** -0.032*
Obese -0.002 -0.037** -0.064*** -0.102***
Occupation
Ref: Managerial/Professional
specialty
Technical/Sales/Administrative -0.029 -0.058*** -0.057*** -0.031
support
Service 0.021 -0.086*** -0.105*** -0.213***
Farming/Fishing/Forestry 0.048 0.084** -0.033 -0.083
Precision production/Craft/
Repair -0.068** -0.03 -0.051** -0.088***
Operators/Fabricators/Laborers -0.033 -0.033 -0.106*** -0.189***
Elementary occupation -0.075* -0.070** -0.069*** -0.149***
Constant -0.780*** 0.598*** 1.664*** 1.576***
Notes: In this estimation, we pool the responses from all the countries together and the total number of observations is 6,652. We included in the
estimation an indicator for missing occupation information. *p < 0.1, **p < 0.05, ***p < 0.01
Disability levels for full disability benefits show remarkably different effects on
reporting styles. More lenient standards to determine disability levels for full disability
benefits are associated with stricter rating styles for work limitations. The effects are
International Journal of Population Studies 2017, Volume 3, Issue 1 55