Page 56 - IJPS-3-1
P. 56

Disability policies and public views on work disability...
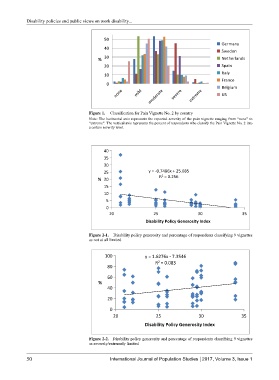


                                              50
                                                                                                Germany
                                              40
                                                                                                Sweden
                                           %  30                                                Netherlands
                                              20                                                Spain
                                              10                                                Italy
                                                                                                France
                                               0                                                Belgium
                                                  none     mild  moderate  severe  extreme      US


                                       Figure 1.  Classification for Pain Vignette No. 2 by country
                                       Note: The horizontal axis represents the reported severity of the pain vignette ranging from “none” to
                                       “extreme”. The vertical axis represents the percent of respondents who classify the Pain Vignette No. 2 into
                                       a certain severity level.


                                             40
                                             35
                                             30
                                             25                 y = -0.7486x + 25.085
                                                                      2
                                           %  20                     R  = 0.256
                                             15
                                             10
                                              5
                                              0
                                                20                 25                30                 35
                                                               Disability Policy Generosity Index


                                       Figure 2-1.    Disability policy generosity and percentage of respondents classifying 9 vignettes
                                       as not at all limited


                                              100              y = 1.6276x - 7.3546
                                                                   R  = 0.083
                                                                    2
                                               80
                                               60
                                           %
                                               40
                                               20

                                                0
                                                 20                 25                30                35
                                                               Disability Policy Generosity Index


                                       Figure 2-2.   Disability policy generosity and percentage of respondents classifying 9 vignettes
                                       as severely/extremely limited


            50                                  International Journal of Population Studies   2017, Volume 3, Issue 1
   51   52   53   54   55   56   57   58   59   60   61