
Page 74 - IJPS-3-1
P. 74
Socioeconomic differentials and disease-free life expectancy of the elderly in Brazil
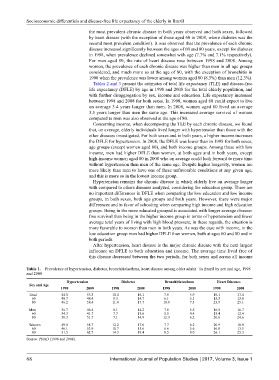
the most prevalent chronic disease in both years observed and both sexes, followed
by heart disease (with the exception of those aged 60 in 2008, where diabetes was the
second most prevalent condition). It was observed that the prevalence of each chronic
disease increased significantly between the ages of 60 and 80 years, except for diabetes
in 1998, when prevalence declined somewhat with age (7.7% and 7.1% respectively).
For men aged 80, the rate of heart disease rose between 1998 and 2008. Among
women, the prevalence of each chronic disease was higher than men in all age groups
considered, and much more so at the age of 80, with the exception of bronchitis in
1998 when the prevalence was lower among women aged 80 (8.5%) than men (12.3%).
Tables 2 and 3 present the estimates of total life expectancy (TLE) and disease-free
life expectancy (DFLE) by age in 1998 and 2008 for the total elderly population, and
with further disaggregation by sex, income and education. Life expectancy increased
between 1998 and 2008 for both sexes. In 1998, women aged 60 could expect to live
on average 3.4 years longer than men. In 2008, women aged 60 lived on average
3.5 years longer than men the same age. This increased average survival of women
compared to men was also observed at the age of 80.
Concerning income, when decomposing the TLE by each chronic disease, we found
that, on average, elderly individuals lived longer with hypertension than those with the
other diseases investigated. For both sexes and in both years, a higher income increases
the DFLE for hypertension. In 2008, the DFLE was lower than in 1998 for both sexes,
age groups (except women aged 80), and both income groups. Among those with low
income, men had higher DFLE than women, at both ages and in both years, except
high-income women aged 80 in 2008 who on average could look forward to more time
without hypertension than men of the same age. Despite higher longevity, women are
more likely than men to have one of these unfavorable conditions at any given age,
and this is more so in the lowest income group.
Hypertension remains the chronic disease in which elderly live on average longer
with compared to others diseases analyzed, considering the education group. There are
no important differences in DFLE when comparing the low education and low income
groups, in both sexes, both age groups and both years. However, there were major
differences and in favor of schooling when comparing high income and high education
groups. Being in the more educated grouped is associated with longer average disease-
free survival than being in the higher income group in terms of hypertension and fewer
average total years of living with high blood pressure; in these regards, the situation is
more favorable to women than men in both years. As was the case with income, in the
low education group men had higher DFLE than women, both at ages 60 and 80 and in
both periods.
After hypertension, heart disease is the major chronic disease with the next largest
influence on DFLE to both education and income. The average time lived free of
this disease decreased between the two periods, for both sexes and across all income
Table 1. Prevalence of hypertension, diabetes, bronchitis/asthma, heart disease among older adults in Brazil by sex and age, 1998
and 2008
Hypertension Diabetes Bronchitis/asthma Heart Diseases
Sex and Age
1998 2008 1998 2008 1998 2008 1998 2008
Total 44.0 53.3 10.4 16.1 7.8 5.9 19.1 17.4
60 40.7 48.4 9.3 14.7 6.1 5.1 15.3 13.0
80 46.2 58.4 11.4 17.7 10.0 7.3 23.9 25.1
Men 36.7 46.4 8.1 14.2 7.8 5.5 16.8 16.7
60 34.3 41.7 7.7 13.6 5.5 4.4 13.4 12.4
80 38.3 51.7 7.1 14.9 12.3 6.2 20.6 24.6
Women 49.8 58.7 12.2 17.6 7.7 6.2 20.9 18.0
60 46.1 53.9 10.7 15.6 6.6 5.6 16.8 13.5
80 51.5 62.7 14.3 19.4 8.5 8.0 26.1 25.3
Source: PNAD (1998 and 2008).
68 International Journal of Population Studies 2017, Volume 3, Issue 1